7 Requirements: Behavior-Driven Design and User Stories
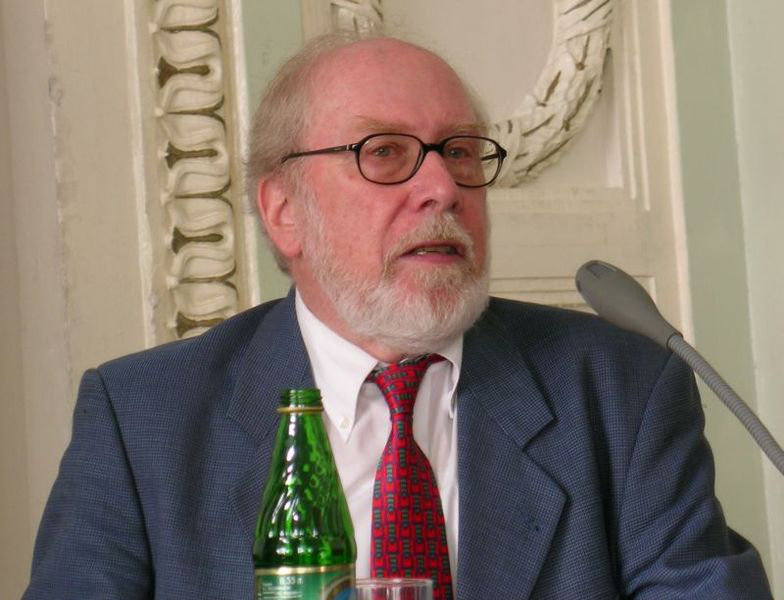
Niklaus Wirth (1934–) received the Turing Award in 1984 for his pioneering contributions to structured programming, in which structured control flow constructs (if/then/else) and loops (while and for) improve the clarity and quality of code. Wirth also developed a sequence of innovative programming languages that embodied these concepts, including Algol-W, Euler, Modula, and Pascal.
Clearly, programming courses should teach methods of design and construction, and the selected examples should be such that a gradual development* can be nicely demonstrated.*
— Niklaus Wirth, “Program Development by Stepwise Refinement,” CACM 14(5), May 1971
Concepts
The big concepts of this chapter are requirements elicitation, cost estimation, project scheduling, and monitoring progress.
The embodiment of these concepts for the Agile lifecycle, which follows Behavior-Driven Development (BDD), are:
User stories to elicit functional requirements.
Low-fidelity (Lo-Fi) user interfaces and storyboards to elicit UI requirements.
Points to turn user stories into cost estimates.
Velocity to measure and estimate schedule.
Using the tool Cucumber to transform user stories into acceptance tests.
Using a simple project-management or issue-tracking tool such as https://docs.github.com/en/issues/planning-and-tracking-with-projects/learning-about-projects/about-projectsGitHub Projects to track project progress.
For the Plan-and-Document lifecycle, you will become familiar with the same concepts in a quite different format:
Requirements elicitation via interviewing, scenarios, and use cases, requirements documentation via a Software Requirements Specification (SRS), and requirements fulfillment using requirements traceability.
Cost estimation based on project manager experience or formulas such as COCOMO, scheduling and monitoring progress using PERT charts, and change management using version control systems for documentation and schedule as well as the code.
Risk analysis and management to increase chances of project being successful.
Both lifecycles illustrate the difference between functional versus non-functional requirements and explicit versus implicit requirements.
7.1 Behavior-Driven Design and User Stories
Behavior-Driven Design is Test-Driven Development done correctly.
— Anonymous
Software projects fail because they don’t do what customers want; or because they are late; or because they are over budget; or because they are hard to maintain and evolve; or all of the above.
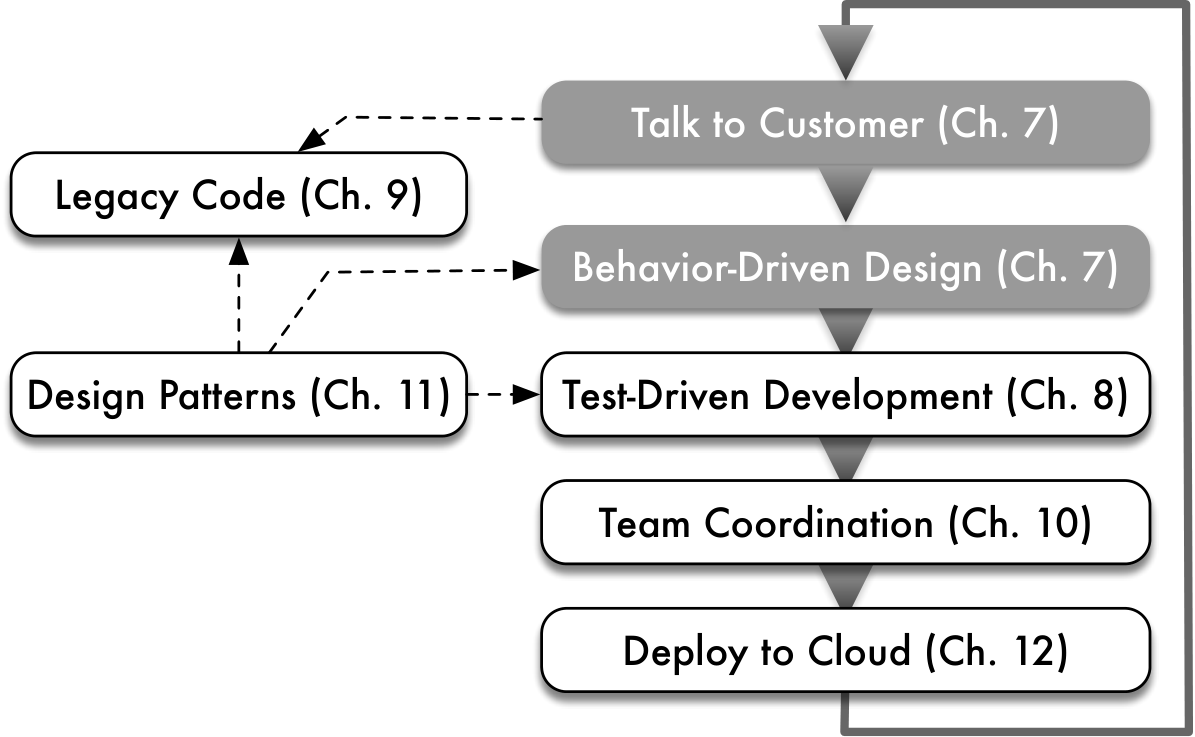
The Agile lifecycle was invented to attack these problems for many common types of software. Figure 7.1 shows one iteration of the Agile lifecycle from Chapter 1, highlighting the portion covered in this chapter. As we saw in Chapter 1, the Agile lifecycle involves:
Agile stakeholders include users, customers, developers, maintenance programmers, operators, project management, ….
Working closely and continuously with stakeholders to develop requirements and tests.
Maintaining a working prototype while deploying new features typically every two weeks—called an iteration—and checking in with stakeholders to decide what to add next and to validate that the current system is what they really want. Having a working prototype and prioritizing features reduces the chances of a project being late or over budget, or perhaps increasing the likelihood that the stakeholders are satisfied with the current system once the budget is exhausted!
Unlike a plan-and-document lifecycle in Chapter 1, Agile development does not switch phases (and people) over time from development mode to maintenance mode. With Agile, you are basically in maintenance mode as soon as you’ve implemented the first set of features. This approach helps make the project easier to maintain and evolve.
We start the Agile lifecycle with Behavior-Driven Design (BDD). BDD asks questions about the behavior of an application before and during development so that the stakeholders are less likely to miscommunicate. Requirements are written down as in plan-and-document, but unlike plan-and-document, requirements are continuously refined to ensure the resulting software meets the stakeholders’ desires. That is, using the terms from Chapter 1, the goal of BDD requirements is validation (build the right thing), not just verification (build the thing right).
The BDD version of requirements is user stories, which describe how the application is expected to be used. They are lightweight versions of requirements that are better suited to Agile. User stories help stakeholders plan and prioritize development. Thus, like plan-and-document, you start with requirements, but in BDD user stories take the place of design documents in plan-and-document.
By concentrating on the behavior of the application versus its implementation, it is easier to reduce misunderstandings between stakeholders. As we shall see in the next chapter, BDD is closely tied to Test-Driven Development (TDD), which does test implementation. In practice they work together hand-in-hand, but for pedagogical reasons we introduce them sequentially.
User stories came from the Human Computer Interface (HCI) community. They developed them using 3-inch by 5-inch index cards or “3-by-5 cards,” or in countries where metric paper sizes are used, A7 cards of 74 mm by 105 mm. (We’ll see other examples of paper and pencil technology from the HCI community shortly.) These cards contain one to three sentences in everyday nontechnical language written jointly by the customers and developers. The rationale is that paper cards are nonthreatening and easy to rearrange, thereby enhancing brainstorming and prioritizing. The general guidelines for the user stories themselves is that they must be testable, be small enough to implement in one iteration, and have business value. Section 7.2 gives more detailed guidance for good user stories.
Note that individual developers working by themselves without customer interaction don’t need these 3-by-5 cards, but this “lone wolf” developer doesn’t match the Agile philosophy of working closely and continuously with the customer.
We will use the RottenPotatoes app from Chapters 3 and 4 as the running example in this chapter and the next one. We start with the stakeholders for this simple app:
The operators of RottenPotatoes, and
The movie fans who are end-users of RottenPotatoes.
We’ll introduce a new feature in Section 7.6, but to help understand all the moving parts, we’ll start with a user story for an existing feature of RottenPotatoes so that we can understand the relationship of all the components in a simpler setting. The user story we picked is to add movies to the RottenPotatoes database:
ch_bdd/code/addmovie.feature
Feature: Add a movie to RottenPotatoes
  As a movie fan
  So that I can share a movie with other movie fans
  I want to add a movie to RottenPotatoes database
Scenario: Add a movie
  Given I am on the RottenPotatoes home page
  When I follow "Add new movie"
  Then I should be on the Create New Movie page
  When I fill in "Title" with "Hamilton"
  And I select "PG-13" from "Rating"
  And I select "July 4, 2020" as the "Released On" date
  And I press "Save Changes"
  Then I should be on the RottenPotatoes home page
And I should see "Hamilton"This user story format was developed by the startup company Connextra and is named after them; sadly, this startup is no longer with us. The format is:
ch_bdd/code/connextra.feature
This format identifies the stakeholder since different stakeholders may describe the desired behavior differently. For example, users may want links to information sources to make it easier to find the information, while operators may want links to trailers so that they can get an income stream from the advertisers. All three clauses have to be present in the Connextra format, but they do not have to be in this order.
Summary of BDD and User Stories
BDD emphasizes working with stakeholders to define the behavior of the system being developed. Stakeholders include nearly everyone: customers, developers, managers, operators, ….
User stories, a device borrowed from the HCI community, make it easy for nontechnical stakeholders to help create requirements.
\(3\times{}5\) cards (or A7-size cards), each with a user story of one to three sentences, are a simple and nonthreatening technology that lets all stakeholders brainstorm and prioritize features.
The Connextra format of user stories captures the stakeholder, the stakeholder’s goal for the user story, and the task at hand.
User stories represent a lightweight approach to use-case analysis, a term traditionally used in software engineering to describe a similar process. A full use case analysis would include the use case name; actor(s); goals of the action; summary of the use case; preconditions (state of the world before the action); steps occurring in the scenario (both the actions performed by the user and the system’s responses); related use cases; and postconditions (state of the world after the action). A use case diagram is a type of UML diagram (see Chapter 11) with stick figures standing in for the actors, and can be used to generalize or extend use cases or to include a use case by reference. For example, if we have a use case for “user logs in” and another use case for “logged-in user views her account summary”, the latter could include the former by reference, since a precondition to the second use case is that the user has logged in.
True or False: User stories on 3x5 cards in BDD play the same role as design requirements in plan-and-document.
True.
Identify the essential elements of a user story.
7.2 SMART User Stories
What makes a good user story versus a bad one? The SMART acronym offers concrete and (hopefully) memorable guidelines: Specific, Measurable, Achievable, Relevant, and Timeboxed.
Specific. Here is an example of a vague feature paired with a specific version:
ch_bdd/code/vaguefeature.rb
Measurable. Adding Measurable to Specific means that each story should be testable, which implies that there are known expected results for some good inputs. Here is an example of an unmeasurable feature versus its measurable counterpart:
ch_bdd/code/unmeasurablefeature.rb
Only the second case can be tested to see if the system fulfills the requirement.
Achievable.
 Ideally, you implement the user story in one Agile iteration. If you are getting less than one story per iteration, then they are too big and you need to subdivide these stories into smaller ones. As mentioned above, the tool Pivotal Tracker measures Velocity, which is the rate of completing stories of varying difficulty.
Relevant. A user story must have business value to one or more stakeholders. To drill down to the real business value, one technique is to keep asking “Why.” Using as an example a ticket-selling app for a regional theater, suppose the proposal is to add a Facebook linking feature. Here are the “Five Whys” in action with their recursive questions and answers:
Why add the Facebook feature? As box office manager, I think more people will go with friends and enjoy the show more.
Why does it matter if they enjoy the show more? I think we will sell more tickets.
Why do you want to sell more tickets? Because then the theater makes more money.
Why does the theater want to make more money? We want to make more money so that we don’t go out of business.
Why does it matter that the theater is in business next year? If not, I have no job.
(We’re pretty sure the business value is now apparent to at least one stakeholder!)
Timeboxed. Timeboxing means that you stop developing a story once you’ve exceeded the time budget. Either you give up, divide the user story into smaller ones, or reschedule what is left according to a new estimate. If dividing looks like it won’t help, then you go back to the customers to find the highest value part of the story that you can do quickly.
The reason for a time budget per user story is that it is extremely easy to underestimate the length of a software project. Without careful accounting of each iteration, the whole project could be late, and thus fail. Learning to budget a software project is a critical skill, and exceeding a story budget and then refactoring it is one way to acquire that skill.
One important concept expands upon the R of SMART. The minimum viable product (MVP) is a subset of the full set of features that when completed has business value in the real world. Not only are the stories Relevant, but the combination of all of them makes the software product viable in the marketplace. Obviously, you can’t start selling the product if it’s not viable, so it makes sense to give priority to the stories that will let the product be shipped. The Epic or a Release point of Pivotal Tracker can help identify the stories of the MVP.
Summary of SMART User Stories
The SMART acronym captures the desirable features of a good user story: Specific, Measurable, Achievable, Relevant, and Timeboxed.
The Five Whys are a technique to help you drill down to uncover the real business relevance of a user story.
Which SMART guideline(s) does the feature below violate?
It is not Specific, not Measurable, not Achievable (within 1 iteration), and not Timeboxed. While business Relevant, this feature goes just one for five.
Rewrite this feature to make it SMART.
Here is one SMART revision of this user story:
ch_bdd/code/SMARTfeature.rb
Given user stories as the work product from eliciting requirements of customers, we can introduce a metric and tool to measure productivity.
Modify a non-SMART user story to make it SMART.
7.3 Lo-Fi User Interface Sketches and Storyboards
We usually need to specify a user interface (UI)
when adding a new feature since many SaaS applications interact with end users. Thus, part of the BDD task is often to propose a UI to match the user stories. If a user story says a user needs to login, then we need a mockup of a page that has the login. Alas, building software prototypes of user interfaces can intimidate stakeholders from suggesting improvements—just the opposite of the effect we need at this early point of the design.
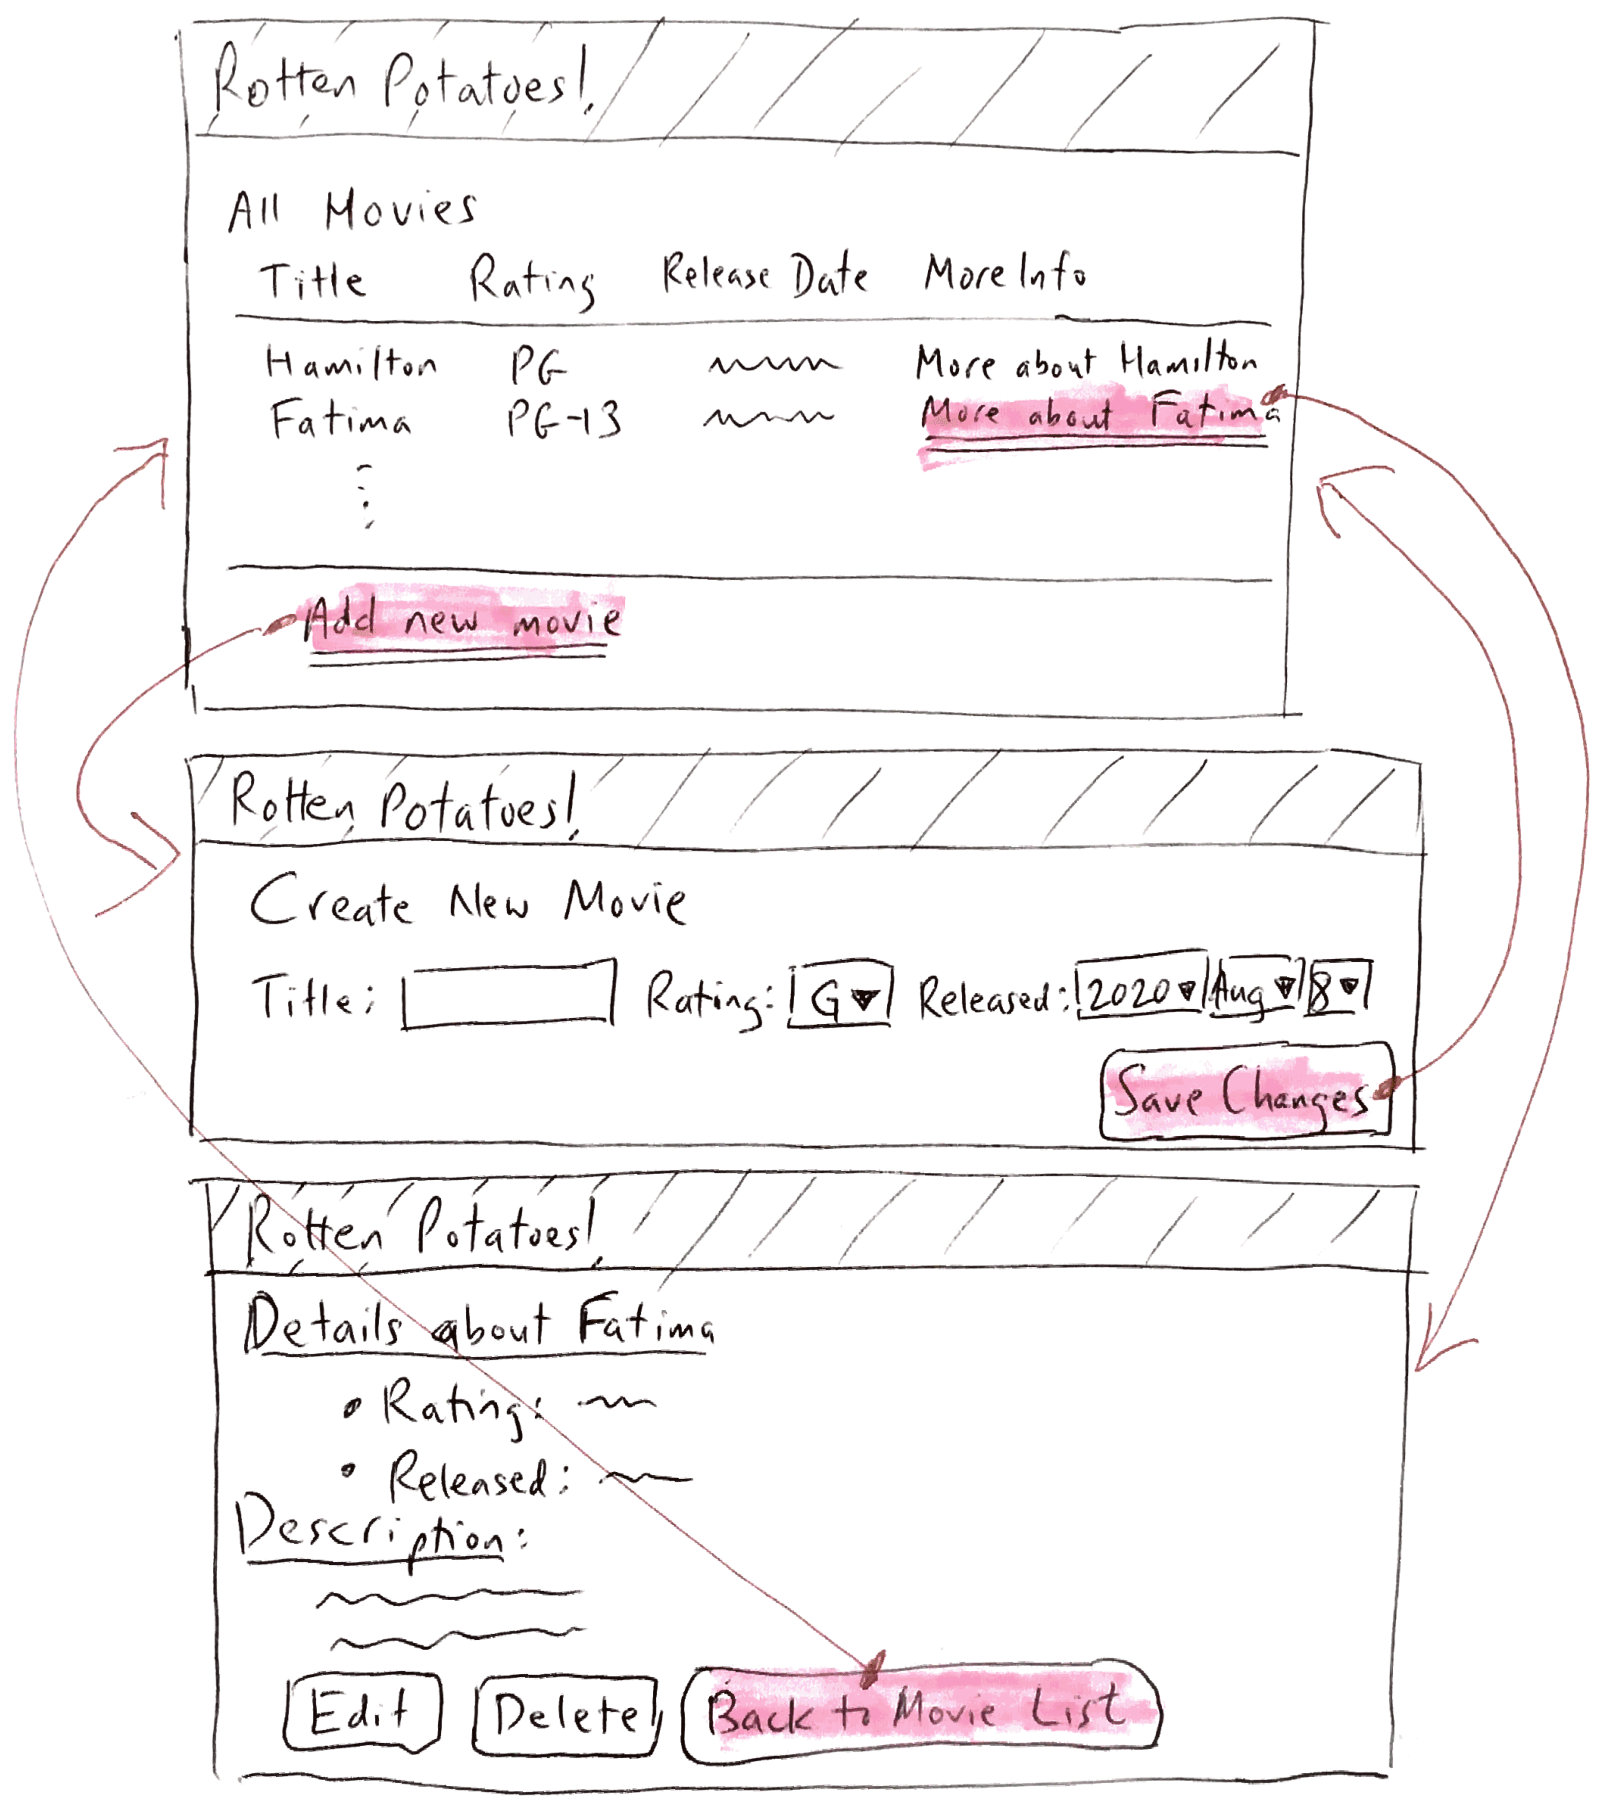
What we want is the UI equivalent of 3x5 cards; engaging to the nontechnical stakeholder and encouraging trial and error, which means it must be easy to change or even discard. Just as the HCI community advocates 3x5 cards for user stories, they recommend using kindergarten tools for UI mockups: crayons, construction paper, and scissors. They call this low-tech approach to user interfaces lo-fi (low-fidelity) UI and the paper prototypes sketches. Ideally, you make sketches for all the user stories that involve a UI. It may seem tedious, but eventually you are going to have to specify all the UI details when using HTML to make the real UI, and it’s a lot easier to get it right with pencil and paper than with code.
A lo-fi sketch shows what the UI looks like at one instant in time. However, we also need to show how the sketches work together as a user interacts with a page. Filmmakers face a similar challenge with scenes of a movie. Their solution, which they call storyboarding, is to go through the entire film as if it was a comic book, with drawings for every scene. Instead of a linear sequence of images like in a movie, the storyboard for a UI is typically a tree or graph of screens driven by different user choices.
To make a storyboard, you must think about all the user interactions with a web app:
Pages or sections of pages,
Forms and buttons, and
Popups.
Figure 7.2 shows a storyboard composed of lo-fi sketches for adding a new movie to RottenPotatoes. The storyboard includes indications of what the user clicks to cause the transitions between sketches. After drawing the sketches and storyboards, you are ready to write HTML. Chapter 3 showed how Erb markup becomes HTML, and how the class and id attributes of HTML elements can be used to attach styling information to them via Cascading Style Sheets (CSS). The key to the lo-fi approach is to get a good overall structure from your sketches, and do minimal CSS (if any) to get the view to look more or less like your sketch. Remember that the common parts of the page layout—banners, structural divs, and so on—can go into views/layouts/application.html.erb.
Start the process by looking at the lo-fi UI sketches and split them into “blocks” of the layout. Use HTML divs for obvious layout sections. There is no need to make it pretty until after you have everything working. Adding CSS styling, images, and so on is the fun part, but make it look good after it works. One reason we have repeatedly advocated for the use of CSS frameworks such as Bootstrap in this book is that they facilitate producing an acceptable-looking prototype quickly.
Summary: Borrowing from the HCI community once again, lo-fi sketches are low cost ways to explore the user interface of a user story. Paper and pencil makes them easy to change or discard, which once again can involve all stakeholders. Storyboards capture the interaction between different pages depending on what the user does. It is much less effort to experiment in this low cost medium before using HTML and CSS to create the pages you want.
True or False: The purpose of lo-fi UI sketches and storyboards is to debug the UI before you program it.
True.
7.4 Points and Velocity
One way to measure the productivity of a team would be simply to count the number of user stories completed per iteration, and then calculate the average. The average would then be used to decide how many stories to try to implement each iteration.
The problem with this measure is that some stories are much harder than others, leading to mispredictions. The simple solution is to give each user story an integer number of points reflecting its perceived difficulty. The “value” of a point—the approximate expected number of coding hours it represents—is completely up to the team, and will likely differ across teams, but the point scale should have two important properties. First, everyone on the team should be in rough agreement on how much a “point” is worth. Second, more points should represent not only more effort, but more uncertainty. For example, your team might start with a simple 3-point scale in which 1 point represents approximately a 3-hour work session. Your team might be good at estimating the effort required to complete a 1 or 2 point story this way, but can you confidently estimate that a 3-point story will really take 9 hours of work? For this reason, your team should also set a threshold above which a story must be broken down into smaller tasks before estimating its difficulty, until each task is sufficiently well understood that it can be estimated with high confidence. Therefore, in our simple suggested introductory scheme, you might decide that any story estimated at higher than 3 points must be subdivided into stories that everyone agrees are 3 points or less.
A practical way to estimate points that also builds the team’s collective ownership (knowledge of different parts of the project being diffused around the team) is known as planning poker. During an Iteration Planning Meeting at the beginning of an iteration, the team first prioritizes the stories according to the stated desires of the customer (or the Product Owner speaking for the customer). Each story is discussed in turn: the Project Manager reads and reviews the story to ensure everyone understands what the story requires, then each team member places a card face-down marked with the number of points they think that story should be worth. An even easier variation is to have everyone simultaneously stick out 1 to 5 fingers, in the style of the children’s game Rock–Paper–Scissors. There should be a card (or hand gesture) that means “I don’t know” and another that means “This story is too complicated and should be broken down.” The team then discusses differences in the votes to reach consensus, and they vote again, possibly after subdividing the story. An inability to reach consensus may indicate a story that isn’t SMART.
Fibonacci scale With more experience, the Fibonacci scale is commonly used: 1, 2, 3, 5, and 8. (Each new number is sum of previous two.) However, at places like Pivotal Labs, 8 is extremely rare.
When should a story get more points? Some stories may require information-gathering, such as becoming familiar with other parts of the codebase or doing some scouting to determine which files or classes in the app will be affected by the proposed feature. A major source of uncertainty, such as figuring out how to integrate a new technology or library, should get its own spike: a short investigation into a technique or problem that the team wants explored before sitting down to do serious coding. An example would be a spike on incorporating recommendations into an app, in which a developer or pair investigates different algorithms and different libraries that could be used, possibly using a scratch branch of the code (which we discuss in Section 10.2) to do some basic testing and exploration. After a spike is done, the spike code must be thrown away: The spike’s purpose is to help you determine what approach you want to follow, and now that you know, you should write it correctly.
The backlog is the collection of stories that have been prioritized and assigned points in this way, but have not yet been started in this iteration. The team then begins delivering the backlog, that is, working on the stories in priority order during the iteration. (Section 10.4 presents best practices for coordinating this work.) At the end of the iteration, the team computes the total number of points completed, rather than the number of stories. The moving average of this total is called the team’s velocity.
Velocity measures work rate based on the team’s self-evaluation. As long as the team rates user stories consistently, it doesn’t matter whether the team is completing 5 points or 10 points per iteration. The purpose of velocity is to give all stakeholders an idea how many iterations it will take a team to add the desired set of features, which helps set reasonable expectations and reduces chances of disappointment. Points and velocity are often used as the basis of a burn down chart, which shows work to be done (points) on the vertical axis and time along the horizontal axis. The slope of the downward-pointing line is the team’s velocity, and the line’s intersection with the x-axis represents the prediction for when the work will be done.
Some teams use GitHub Issues to track stories as a to-do list, or a project management tool such as Trello or GitHub Projects to put virtual story cards on a virtual wall. These simpler tools are fine to start out with, but they lack the ability to automatically track points and velocity, and therefore to supply estimates of story completion time in more complicated projects.
Pivotal Tracker was an excellent and free (for many users) Web-based tool that supported these tasks exceptionally well. Sadly, it was shut down in 2025.
One way to simplify manual tracking of points and velocity with GitHub Projects is to break down a task into roughly equal lightweight (1-point) stories; the main task can then be entered as an Issue that has the subtasks as sub-issues.
In addition, it is helpful to be able to store information about the project—design notes, architecture diagrams, lo-fi sketches, and so on—with the associated user stories or issues, which GitHub Issues does not support except by including links in the issue description or comments. Every GitHub repository also includes a Wiki, which allows team members to jointly edit a document and add files.
Commercial tools such as Jira have more support for features such as automatic velocity tracking and associating additional information with a story, but can be complicated to learn and set up and potentially costly to use. Whatever tool you choose, the important thing is to keep all documentation about the project accessible from one place that the whole team can agree on, and which will remain stable even as members of the team come and go.
Summary of points and velocity:
To help the team manage each iteration and to predict how long the team will take to implement new features, the team assigns points to rate difficulty of user stories and tracks the team’s velocity, or average points per iteration.
Techniques such as planning poker, in which team members simultaneously “vote” on the difficulty of a story and then discuss discrepancies, are a quick and practical way to estimate points while diffusing knowledge of the project throughout the team.
Simpler project-management tools such as GitHub Issues and GitHub Projects do not provide specific support for calculating points and velocity, but it is possible to approach the effect by subdividing an issue into sub-issues of roughly equal estimated difficulty.
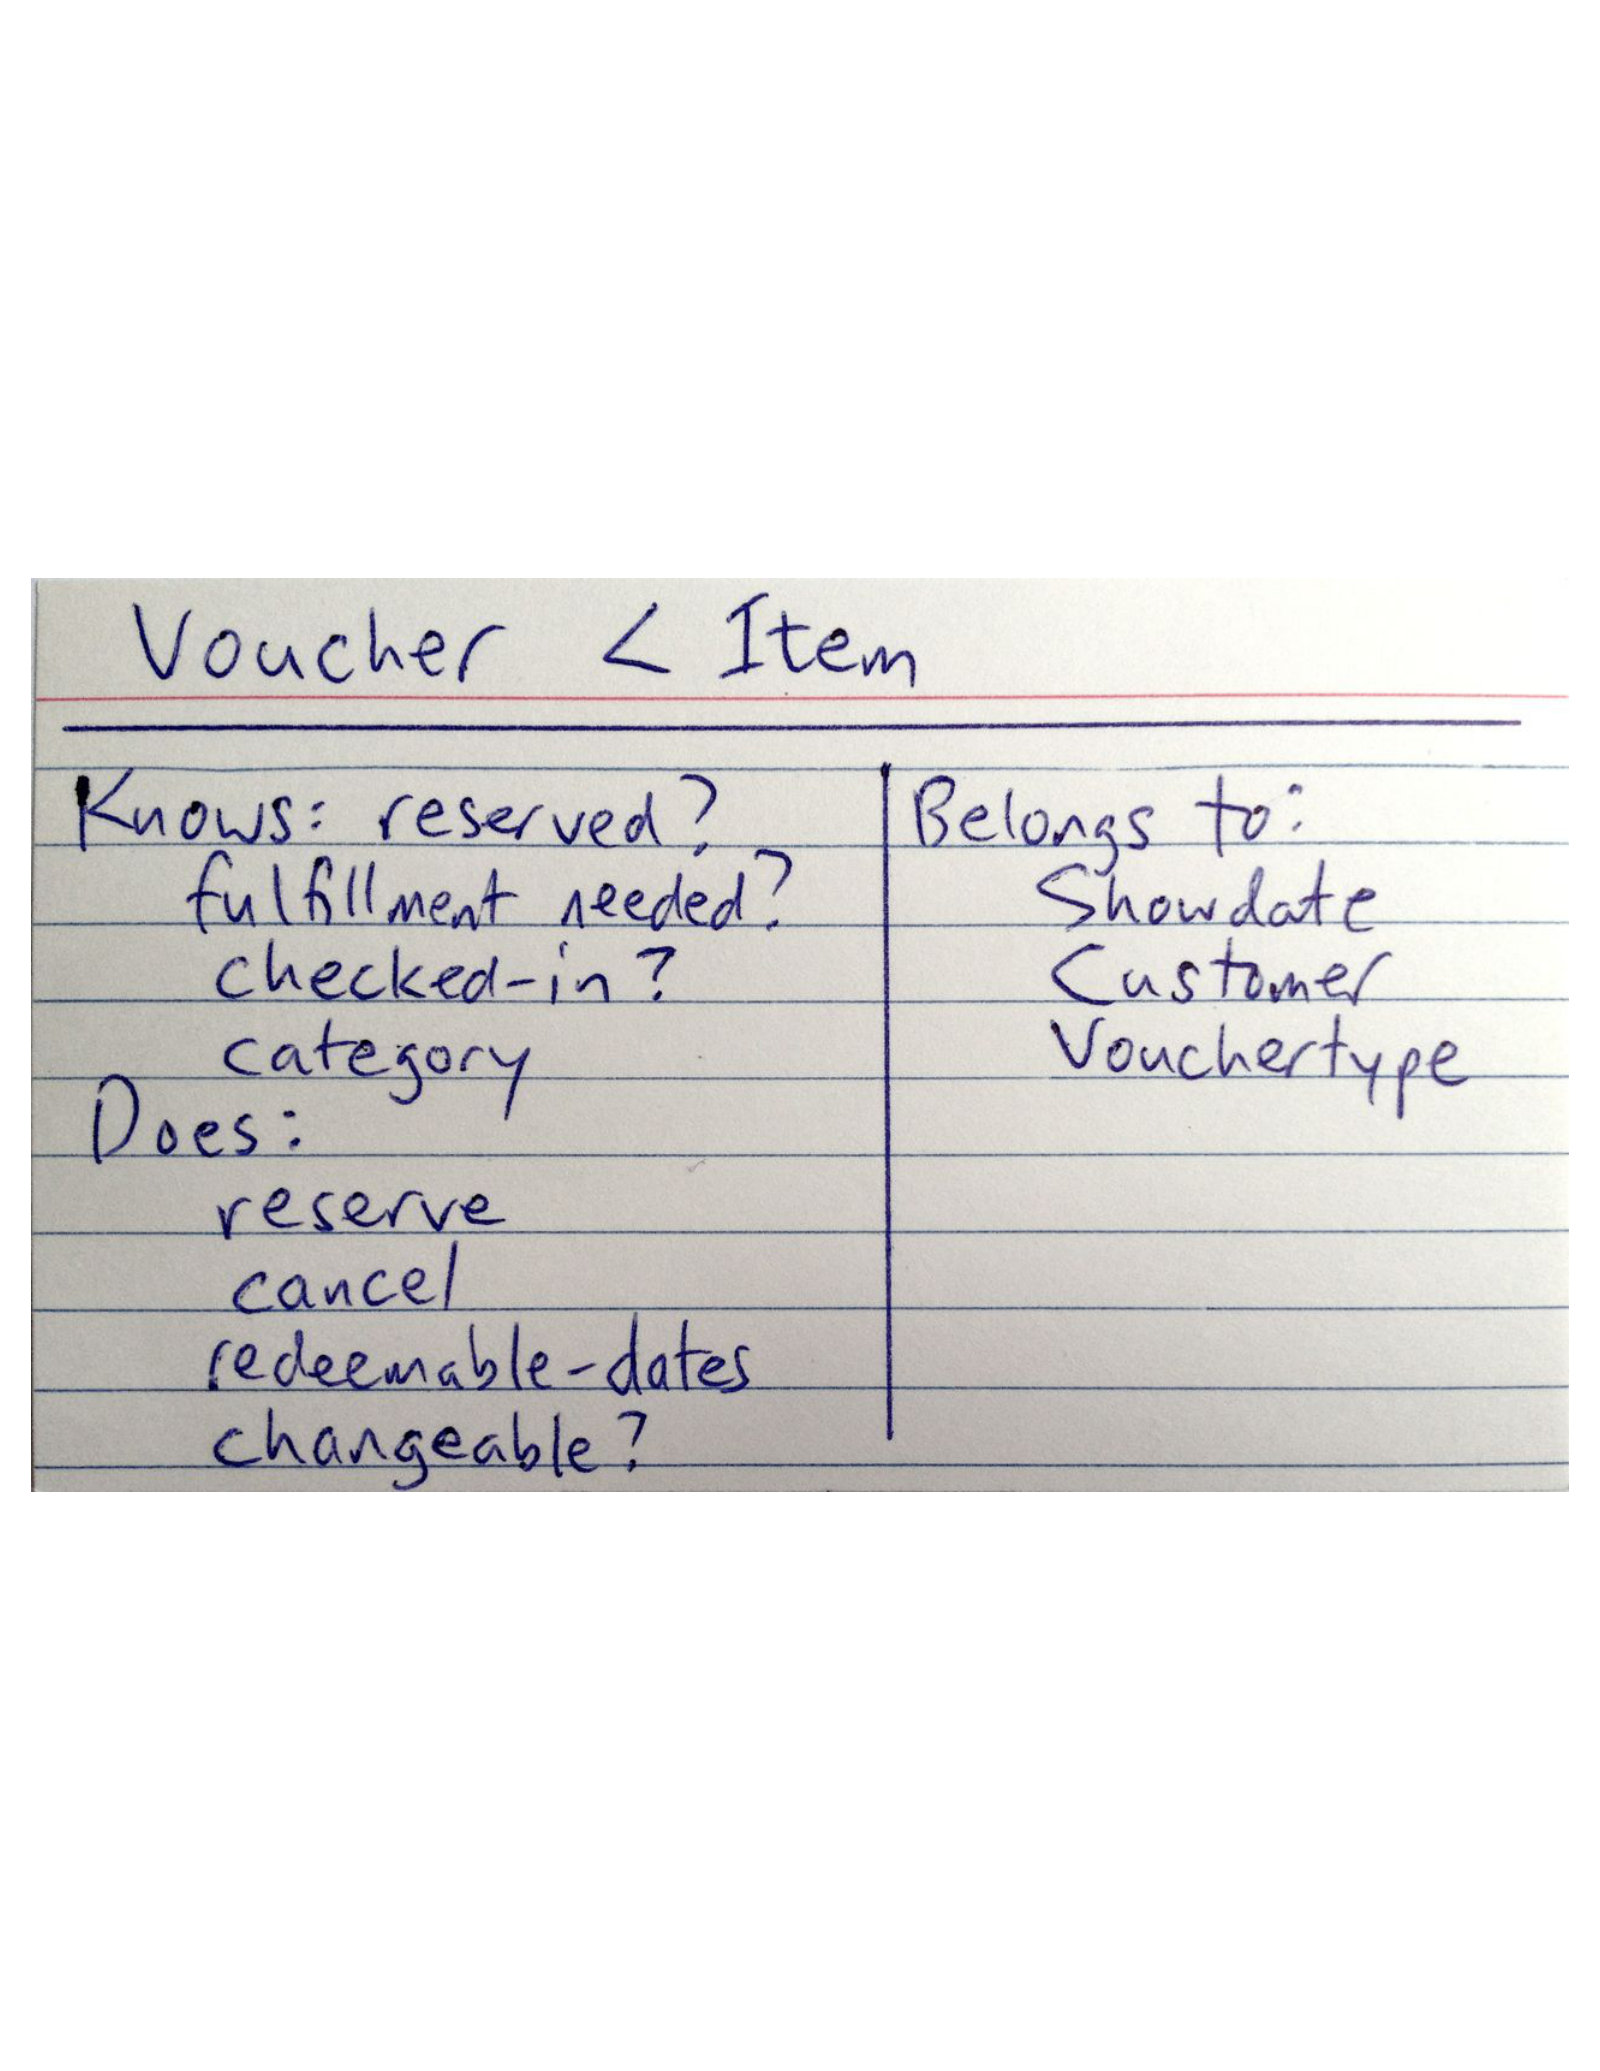
Voucher class from Figure 9.4. The left column represents Voucher’s responsibilities—things it knows (instance variables) or does (instance methods). Since Ruby instance variables are always accessed through instance methods, we can determine responsibilities by searching the class file voucher.rb for instance methods and calls to attr_accessor. The right column represents Voucher’s collaborator classes; for Rails apps we can determine many of these by looking for has_many and belongs_to in voucher.rb.
CRC cards (Figure 7.3) were proposed in 1989 as a way to help with object-oriented design. Each card identifies one class, its responsibilities, and collaborator classes with which it interacts to complete tasks. As this external screencast shows, a team designing new code selects a user story (Section 7.1). For each story step, the team identifies or creates the CRC card(s) for the classes that participate in that step and confirms that the classes have the necessary Responsibilities and Collaborators to complete the step. If not, the collection of classes or responsibilities may be incomplete, or the division of responsibilities among classes may need to be changed. When exploring legacy code, you can create CRC cards to document the classes you find while following the flow from the controller action that handles a user story step through the models and views involved in the other story steps.
True or False: When comparing two teams, the one with the higher velocity is more productive.
False: Since each team assigns points to user stories, you cannot use velocity to compare different teams. However, you could look over time for a given team to see if there were iterations that were significantly less or more productive.
True or False: When you don’t know how to approach a given user story, just give it 3 points.
False: A user story should not be so complex that you don’t have an approach to implementing it. If they are, you should go back to your stakeholders to refactor the user story into a set of simpler tasks that you do know how to approach.
Describe how planning poker or a similar activity is used to arrive at effort estimates during an Iteration Planning Meeting.
7.5 Agile Cost Estimation
Given that the Agile Manifesto values customer collaboration over contract negotiation, it is unsurprising that it does not follow the plan-and-document approach of making a cost estimate and schedule for a given set of features as part of a bid to win a contract, as we shall see in Section 7.10. This section describes the process at Pivotal Labs, which relies upon Agile development ((Burkes 2012)).
Pivotal Labs is a software consultancy that teaches clients the Agile lifecycle while collaborating with them to develop a specific software product.
Because Pivotal does Agile, Pivotal never commits to delivering features X, Y, and Z by date D. Pivotal commits to providing a certain amount of resources to work in the most efficient way possible up to date D. Along the way, Pivotal needs the client to work with the project team to define priorities, and let Tracker’s velocity guide the decisions as to which features actually make it into the release on date D.
A potential client first gets in contact with the Agile team. If it looks like a good fit for the Agile team, they do a 30 to 60 minute phone call telling the potential client what an engagement looks like, how it’s different from other “outsourcing” agencies, what type of time commitment it will require on the customer’s part, and so on. This first call makes clear that the Agile team works on a time and materials basis, not on a fixed bid basis, as is usually the case with plan-and-document processes. The Agile team gets them to describe at a high level what they want developed, what their current development process looks like, what their current staffing is, and so on.
If the client is comfortable with what they heard, and the Agile team thinks it still sounds like a good fit, the client visits for what Pivotal calls a “scoping.” A scoping is a roughly 90 minute conversation with a potential client, preferably in person. The Agile team asks the client to bring the person responsible for the product, a lead developer if they have one, a designer if they have one, any existing designs for what they want built, and so on. Basically, the client representatives bring whatever they think can clarify exactly what they want done, and the Agile team brings two engineers to the scoping.
During the scoping, the Agile team asks the client to describe what they want done in detail, and they ask a series of questions designed to identify unknowns, risks, external integrations, and so forth. Essentially, the Agile team wants to identify anything that would add uncertainty to the estimate that the Agile team will deliver. If the Agile team gets a client with a very clear definition of what they want to build, a finished design, no external integrations, and so on, the Agile team can produce a fairly tightly-scoped estimate, such as “20 to 22 weeks.” On the other hand, if they don’t have clear product definition, lots of external integrations, or other uncertainty, the Agile team’s estimate will have a greater range, such as “18 to 26 weeks.” If you use pair programming (see Section 2.2), as Pivotal Labs does, the cost estimates would be in “pair weeks.”
After the client leaves the scoping, the Pivots (engineers) involved will stay behind for another 15 to 30 minutes, and agree on an estimate in terms of weeks. They deliver their findings, which include the estimate, identification of risks, and so on, to the sales staff, who then turn that into a proposal email to the client.
Because the Agile team does time and materials only, it’s easy to turn estimated weeks into an estimated range of expense.
Summary: Following the Agile Manifesto’s emphasis on customer cooperation over contracts, an Agile team’s notion of “cost estimation” is therefore more about advising the client on what team size can provide the maximum efficiency, following Brooks’s Law that there is a point of diminishing returns on team size (see Section 7.11). The Agile team’s goal in the scoping process is to identify that point, then ramp the team up to that size over time. Agile companies bid costs for time and materials based on short discussions with external customers. As we shall see in Section 7.10, this approach is in sharp contrast with companies that follow plan-and-document processes, which promise customers a set of features for an agreed upon cost by an agreed upon date.
True or False: As practitioners of Agile Development, Pivotal Labs does not use contracts.
False. Pivotal certainly offers customers a contract that they sign, but it is primarily a promise to pay Pivotal for its best effort to make the customer happy over a limited range of time.
With the already helpful role of user stories for measuring progress behind us, we introduce a tool that lets user stories play yet another important role.
7.6 Cucumber: From User Stories to Acceptance Tests
Remarkably enough, the tool Cucumber turns customer-understandable user stories into acceptance tests, which ensure the customer is satisfied, and integration tests, which ensure that the interfaces between modules have consistent assumptions and communicate correctly. (Chapter 1 describes types of testing.) The key is that Cucumber meets halfway between the customer and the developer: user stories don’t look like code, so they are clear to the customer and can be used to reach agreement, but they also aren’t completely free-form. This section explains how Cucumber accomplishes this minor miracle.
In the Cucumber context we will use the term user story to refer to a single feature with one or more scenarios that show different ways a feature is used. The keywords Feature and Scenario identify the respective components. Each scenario is in turn composed of a sequence of typically 3 to 8 steps. Expanding a user story into a set of scenarios also helps developers enumerate the various user-visible conditions that will be tested to ensure the feature works. For example, consider a fictitious e-commerce site that wants developers to implement the feature Customer can use “guest checkout” to make a purchase without creating an account. This might be broken down into several scenarios:
Customer can complete a purchase as guest
Customer cannot do a guest purchase if the order includes a gift
Multiple guest checkouts associated with same email address group the orders into the same account
Notice in particular the third scenario, which might arise from conversation with the customer while discussing the feature: “Well, what happens if the same email address appears on multiple orders but that user has no account? Should we associate those orders with the same customer internally?” Indeed, such discussions are vital to fleshing out ambiguities in the customer’s desired features.
ch_bdd/code/addmovie.feature
Feature: Add a movie to RottenPotatoes
  As a movie fan
  So that I can share a movie with other movie fans
  I want to add a movie to RottenPotatoes database
Scenario: Add a movie
  Given I am on the RottenPotatoes home page
  When I follow "Add new movie"
  Then I should be on the Create New Movie page
  When I fill in "Title" with "Hamilton"
  And I select "PG-13" from "Rating"
  And I select "July 4, 2020" as the "Released On" date
  And I press "Save Changes"
  Then I should be on the RottenPotatoes home page
And I should see "Hamilton"Figure 7.4 is an example user story, showing a feature with one scenario of adding the movie Hamilton; the scenario has nine steps. (We show just a single scenario in this example, but features usually have many scenarios.) Although stilted writing, this format that Cucumber can act upon is still easy for the nontechnical customer to understand, providing a common representation of the story on which the customer and team can now collaborate—a founding principle of Agile and BDD.
Cucumber keywords Given, When, Then, And, and But have different names just for the benefit of human readers, but they are all aliases to the same method.
Each step of a scenario starts with its own keyword. Steps that start with Given usually set up some preconditions, such as navigating to a page. Steps that start with When typically use one of Cucumber’s built-in web steps to simulate the user pressing a button, for example. Steps that start with Then will usually check to see if some condition is true. The conjunctions But and And allows more complicated versions of Given, When, or Then phrases.
A separate set of files defines the Ruby code that tests these steps. These are called step definitions. How does Cucumber match each step of a scenario with the correct step definitions? The trick is that Cucumber uses regular expressions or regexes (Chapter 2) to match the phrases in the scenario steps to the step definitions themselves. For example, below is a string from a step definition in the scenario for RottenPotatoes:
This regex can match the text “I am on the RottenPotatoes home page” on line 6 of Figure 7.4. The regex also captures the string after the phrase “am on ” until the end of the line (“the RottenPotatoes home page”). The body of the step definition contains Ruby code that tests the step, likely using captured strings such as the one above. Thus, most step definitions are typically used by many different steps. You can think of step definitions as method definitions, and the steps of the scenarios are analogous to method calls.
We then need a tool that will act as a user and pretend to use the feature under different scenarios. In the Rails world, this tool is called Capybara, and Cucumber integrates seamlessly with it. Capybara “pretends to be a user” by taking actions in a simulated web browser, for example, clicking on a link or button. Capybara can interact with the app to receive pages, parse the HTML, and submit forms as a user would. In the rest of this chapter and its associated CHIPS, you will write your own steps to describe the app’s behavior, then connect the steps to step definitions that actually stimulate the app to instantiate the behaviors—the core of Behavior-Driven Design.
Finally, the simple scenario above only describes one particular happy path of the feature in question, but it is also important to agree with the customer on what should happen when things go wrong. For example, if the user leaves the movie title blank, we would probably want to redisplay the Create New Movie page, but perhaps with an error message informing the user of what went wrong. This “sad path” would get its own scenario in the feature file and its own storyboard, since describing what happens when things go wrong is part of the overall feature.
Summary of Cucumber Introduction
Cucumber lets you use a stylized, restricted form of English to describe a set of user stories, or scenarios, that collectively describe a feature.
The steps of a Cucumber scenario use the keyword
Givento describe the current state,Whento identify user actions, andThento describe the intended consequences of those actions.Each scenario step is matched to a step definition using regular expressions. A typical step definition uses the browser simulator Capybara to simulate a user’s actions corresponding to that step, or interrogates the app to check if the desired consequences of the user’s actions have occurred.
Given that Cucumber step definitions are just Ruby code, in principle we could just write the entire scenario in Ruby, rather than writing steps in stilted English and looking up the step definition for each step. Why do you think Cucumber has remained popular despite this fact?
The customer can (probably) read the Cucumber scenario steps and understand the description of what the app is supposed to do, and can determine whether they agree with that description. Most customers would find it much more difficult to read Ruby code. Thus the scenarios provide a common ground on which the technical team and customer can meet.
7.7 CHIPS: Intro to BDD and Cucumber
 https://github.com/saasbook/hw-bdd-cucumber
In this exercise you’ll write Cucumber scenarios to both test existing features and drive the creation of new features in the RottenPotatoes app. (Section 9.3 describes characterization tests, which are created after the fact to describe existing app behaviors. This exercise is an example of creating such a test.)
7.8 Explicit vs. Implicit and Imperative vs. Declarative Scenarios
Now that we have seen user stories and Cucumber in action, we are ready to cover two important testing topics that involve contrasting perspectives.
The first is explicit versus implicit requirements. A large part of the formal specification in plan-and-document is requirements, which in BDD are user stories developed by the stakeholders. Using the terminology from Chapter 1, they typically correspond to acceptance tests. Implicit requirements are the logical consequence of explicit requirements, and typically correspond to what Chapter 1 calls integration tests. An example of an implicit requirement in RottenPotatoes might be that by default movies should be listed in chronological order by release date.
The good news is that you can use Cucumber to kill two birds with one stone—create acceptance tests and integration tests—if you write user stories for both explicit and implicit requirements. (The next chapter shows how to use another tool for unit testing.)
The second contrasting perspective is imperative versus declarative scenarios. The example scenario in Figure 7.4 above is imperative, in that you are specifying a logical sequence of user actions: filling in a form, clicking on buttons, and so on. Imperative scenarios tend to have complicated When statements with lots of And steps. While such scenarios are useful in ensuring that the details of the UI match the customer’s expectations, it quickly becomes tedious and non-DRY to write most scenarios this way.
To see why, suppose we want to write a feature that specifies that movies should appear in alphabetical order on the list of movies page. For example, “Zorro” should appear after “Apocalypse Now”, even if “Zorro” was added first. As Figure 7.5 shows, it would be the height of tedium to express this scenario naively, because it mostly repeats lines from our existing “add movie” scenario—not very DRY. Cucumber is supposed to be about behavior rather than implementation—focusing on what is being done—yet in this poorly-written scenario, only line 18 mentions the behavior of interest.
ch_bdd/code/imperative_bad_scenario.feature
Feature: movies should appear in alphabetical order, not added order

Scenario: view movie list after adding 2 movies (imperative and non-DRY)

  Given I am on the RottenPotatoes home page
  When I follow "Add new movie"
  Then I should be on the Create New Movie page
  When I fill in "Title" with "Zorro"
  And I select "PG" from "Rating"
  And I press "Save Changes"
  Then I should be on the RottenPotatoes home page
  When I follow "Add new movie"
  Then I should be on the Create New Movie page
  When I fill in "Title" with "Apocalypse Now"
  And I select "R" from "Rating"
  And I press "Save Changes"
  Then I should be on the RottenPotatoes home page
Then I should see "Apocalypse Now" before "Zorro" on the RottenPotatoes home page sorted by titlech_bdd/code/declarative_good_scenario.feature
ch_bdd/code/declarative_steps.rb
Given /I have added "(.*)" with rating "(.*)"/ do |title, rating|
  steps %Q{
    Given I am on the Create New Movie page
    When  I fill in "Title" with "#{title}"
    And   I select "#{rating}" from "Rating"
    And   I press "Save Changes"
  }
end

Then /I should see "(.*)" before "(.*)" on (.*)/ do |string1, string2, path|
  steps %Q{Given I am on #{path}}
  regexp = /#{string1}.*#{string2}/m #  /m means match across newlines
  expect(page.body).to match(regexp)
endmovie_steps.rb creates new step definitions matching lines 5–7 of the declarative scenario by reusing existing steps. (Recall from Figure 2.2 that %Q is an alternative syntax for double-quoting a string.) We will learn about expect, which appears in line 13, in the next chapter.
An alternative approach is to think of using the step definitions to make a domain language (which is different from a formal Domain Specific Language (DSL)) for your application. A domain language is informal but uses terms and concepts specific to your application, rather than generic terms and concepts related to the implementation of the user interface. Steps written in a domain language are typically more declarative than imperative in that they describe the state of the world rather than the sequence of steps to get to that state and they are less dependent on the details of the user interface. Figure 7.5 shows what a declarative version of the above scenario might look like using a domain language for RottenPotatoes. The declarative version is obviously shorter, easier to maintain, and easier to understand since the text describes the state of the app in a natural form: “I am on the RottenPotatoes home page sorted by title.”
 The good news is that, as Figure 7.5 shows, you can reuse existing imperative steps to implement such scenarios. This is a very powerful form of reuse, and as your app evolves, you will find yourself reusing steps from your first few imperative scenarios to create more concise and descriptive declarative scenarios. Declarative, domain-language-oriented scenarios focus the attention on the feature being described rather than the low-level steps you need to set up and perform the test.
 Finally, Cucumber provides two other ways to DRY out repetitive scenarios. First, Figure 7.6 shows a scenario outline, in which the scenario steps use placeholders in angle brackets and a subsequent table provides the values. The keyword
 Scenario Outline: must introduce the scenario and Examples: must precede the table of values. Scenario outlines require no special code in the step definitions, since Cucumber will simply run the scenario once for each row in the table body, substituting the given values for the placeholders.
A second way to DRY out a repetitive scenario is to specify a table of values that will be consumed by the step definition, as in Figure 7.6. In this case, each row of the table is provided as a hash whose keys are the table column headers and whose values come from that row of the table, as Figure 7.6 shows.
ch_bdd/code/scenario_outline.feature
Feature: movies should appear in alphabetical order, not added order

Scenario Outline: add movies in order
  When I add the movie "<first_movie>"
  And I add the movie "<second_movie>"
  Then "<first_movie>" should appear <where> "<second_movie>" on the RottenPotatoes home page sorted by title

  Examples:
    | first_movie | second_movie      | where  |
    | Zorro       | Apocalypse Now    | after  |
    | Frozen      | Toy Story         | before |
    | Zorro       | Zombie Apocalypse | after  |
ch_bdd/code/scenario_table.feature
Summary:
We can use Cucumber for both acceptance and integration testing if we write user stories for both explicit and implicit requirements. Declarative scenarios are simpler, less verbose, and more maintainable than imperative scenarios.
As you get more experienced, the vast majority of your user stories should be in a domain language that you have created for your app via your step definitions, and the stories should worry less about user interface details. The exception is for the specific stories where there is business value (customer need) in expressing the details of the user interface.
Scenario Outlines and table-based steps can help DRY out scenarios and keep them concise and easy to read.
True or False: Explicit requirements are usually defined with imperative scenarios and implicit requirements are usually defined with declarative scenarios.
False. These are two independent classifications; both requirements can use either type of scenario.
Rewrite a low-level imperative scenario as a high-level declarative scenario by inventing and applying an appropriate domain language.
7.9 CHIPS: Using BDD to Add a New Feature
https://github.com/saasbook/hw-acceptance-unit-test-cycle
In this assignment you will create Cucumber scenarios not to test an existing feature as in CHIPS 7.7 but to drive the process of adding a new feature, “find movies with same director.” You will create a scenario and then incrementally write the code to make each step pass. Along the way you’ll measure code coverage (which we discuss in more detail in Section 8.7) to make sure you are thoroughly testing your code.
7.10 The Plan-And-Document Perspective on Documentation
As is well known to software engineers (but not to the general public), by far the largest class of [software] problems arises from errors made in the eliciting, recording, and analysis of requirements.
*— Daniel Jackson, Martyn Thomas, and Lynette Millett (Editors), Software for Dependable Systems: Sufficient Evidence?, 2007
Recall that the hope for plan-and-document methods was to make software engineering as predictable in budget and schedule as civil engineering.
It’s worth recalling that novel civil engineering projects, or modifications after the fact, often suffer cost and time overruns as well. Civil engineers tend to have better success predicting project outcomes when the project is similar to others that have been successfully completed in the past.
Remarkably, user stories, points, and velocity correspond to seven major tasks of the plan-and-document methodologies. They include:
Requirements Elicitation
Requirements Documentation
Cost Estimation
Scheduling and Monitoring Progress
These are done up front for the Waterfall model and at the beginning of each major iteration for the Spiral and RUP models. As requirements change over time, these items above imply other tasks:
Change Management for Requirements, Cost, and Schedule
Ensuring Implementation Matches Requirement Features
Finally, since accuracy of the budget estimate and the schedule is vital to the success of the plan-and-document process, there is another task not found in BDD:
- Risk Analysis and Management
The hope is that by imagining all the risks to the budget and schedule in advance, the project can make plans to avoid or overcome them.
As we shall see in Chapter 10, the plan-and-document processes assume that each project has a manager. While the whole team may participate in requirements elicitation and risk analysis and help document them, it is up to the project manager to estimate costs, make and maintain the schedule, and decide which risks to address and how to overcome or avoid them.
Advice for project managers comes from all corners, from practitioners who offer guidelines and rules of thumb based on their experience to researchers who have measured many projects to come up with formulas for estimating budget and schedule. There are also tools to help. Despite this helpful advice and tools, the project statistics from Chapter 1 ((Johnson 1995, 2009))—that 40% to 50% of projects exceed the budget and schedule by factors of 1.7 to 3.0, and that 20% to 30% of projects are cancelled or abandoned—document the difficulty of making accurate budgets and schedules.
We now give quick overviews of these seven tasks so that you can be familiar with what is done in plan-and-document processes to give you a head start if you need to use them in the future. These overviews help explain the inspiration for the Agile Manifesto. If you are unclear on how to successfully perform these tasks, it may be due more to their inherent difficulties rather than to brevity.
1. Requirements Elicitation. Like User Stories, requirements elicitation involves participation by all stakeholders, using one of several techniques. The first is interviewing, where stakeholders answer predefined questions or just have informal discussions. Note that one goal is to understand the social and organization environment to see how tasks are really done versus the official story. Another technique is to cooperatively create scenarios, which can start with an initial assumption of the state of the system, show the flow of the system for a happy case and a sad case, list what else is going on in the system, and then the state of the system at the end of the scenario. Related to scenarios and user stories, a third technique is to create use cases, which are lists of steps between a person and a system to achieve a goal (see the elaboration in Section 7.1).
In addition to functional requirements such as those listed above, non-functional requirements include performance goals, dependability goals, and so on.
2. Requirements Documentation. Once elicited, the next step is to document the requirements in a Software Requirements Specification (SRS). Figure 7.7 gives an outline for an SRS based on IEEE Standard 830-1998. A SRS for a patient management system is 14 pages long, but they are often hundreds of pages.
| Table of Contents |
| 1. Introduction |
| 1.1 Purpose |
| 1.2 Scope |
| 1.3 Definitions, acronyms, and abbreviations |
| 1.4 References |
| 1.5 Overview |
| 2. Overall description |
| 2.1 Product perspective |
| 2.2 Product functions |
| 2.3 User characteristics |
| 2.4 Constraints |
| 2.5 Assumptions and dependencies |
| 3. Specific requirements |
| 3.1 External interface requirements |
| 3.1.1 User interfaces |
| 3.1.2 Hardware interfaces |
| 3.1.3 Software interfaces |
| 3.1.4 Communication interfaces |
| 3.2 System features |
| 3.2.1 System feature 1 |
| 3.2.1.1 Introduction/purpose of feature |
| 3.2.1.2 Stimulus/response sequence |
| 3.2.1.3 Associated function requirements |
| 3.2.1.3.1 Functional requirement 1 |
| … |
| 3.2.1.3.n Functional requirement n |
| 3.2.2 System feature 2 |
| … |
| 3.2.m System feature m |
| 3.3 Performance requirements |
| 3.4 Design constraints |
| 3.5 Software system attributes |
| 3.6 Other requirements |
Part of the process is to check the SRS for:
Validity–are all these requirements really necessary?
Consistency–do requirements conflict?
Completeness–are all requirements and constraints included?
Feasibility–can the requirements really be implemented?
Techniques to test for these four characteristics include having stakeholders—developers, customers, testers, and so on—proofread the document, trying to build a prototype that includes the basic features, and generating test cases that check the requirements.
A project may find it useful to have two types of SRS: a high-level SRS that is for management and marketing and a detailed SRS for the project development team. The former is presumably a subset of the latter. For example, the high-level SRS might leave out the functional requirements that correspond to 3.2.1.3 in Figure 7.7.
Formal specification languages such as Alloy or Z allow the project manager to write executable requirements, which makes it easier to validate the implementation. Not surprisingly, the cost is both a more difficult document to write and usually a much longer requirements document to read. The advantage is both precision in the specification and the potential to automatically generate tests cases or even use formal methods for verification of correctness (see Section 8.10).
3. Cost Estimation. The project manager then decomposes the SRS into the tasks to implement it, and then estimates the number of weeks to complete each task. The advice is to decompose no finer than one week. Just as a user story with more than seven points should be divided into smaller user stories, any task with an estimate of more than eight weeks should be further divided into smaller tasks.
The total effort is traditionally measured in person-months, perhaps in homage to Brooks’s classic software engineering book The Mythical Man-Month ((Brooks 1995)). Managers use salaries and overhead rates to convert person-months into an actual budget.
The cost estimate is likely done twice: once to bid a contract, and once again after the contract is won. The second estimate is done after the software architecture is designed, so that the tasks as well as the effort per task can be more easily and accurately identified.
The project manager surely wants the second estimate to be no larger than the first, since that is what the customer will pay. One suggestion is to add a safety margin by multiplying your original estimate by 1.3 to 1.5 to try to handle estimation inaccuracy or unforeseen events. Another is to make three estimates: a best case, expected case, and worst case, and then use that information to make your best guess.
The two approaches to estimating are experiential or quantitative. The first assumes the project managers have significant experience either at the company or in the industry, and they rely on that experience to make accurate estimates. It certainly increases confidence when the project is similar to tasks that the organization has already successfully completed.
The quantitative or algorithmic approach is to estimate the programming effort of the tasks in a technical measure such as lines of code (LOC), and then divide by a productivity measure like LOC per person-month to yield person-months per task. The project manager can get help from others to get estimates on LOC, and like velocity, can look at the historical record of the organization’s productivity to calculate person-months.
Since cost estimates for software projects have such a dismal record, there has been considerable effort on improving the quantitative approach by collecting information about completed projects and finding models that predict the outcomes ((Boehm and Valerdi 2008)). The next step in sophistication follows this formula: \[\begin{equation} \textrm{Effort} = \textrm{Organizational Factors} \times \textrm{Code Size}^{\textrm{Size Penalty}} \times \textrm{Product Factors} \end{equation}\]
Constructive Cost Model (COCOMO) is the basis of this 1981 formula. Its 1995 successor is called COCOMO II.
where Organizational Factors include practices for this type of product, Code Size is measured as before, Size Penalty reflects that effort is not linear in code size, and Product Factors include experience of development team with this type of product, dependability requirements, platform difficulty, and so on. Example constants from real projects are 2.94 for Organizational Factors; Size Penalty between 1.10 and 1.24; and Product Factors between 0.9 and 1.4.
While these estimates are quantitative, they certainly depend on the project manager’s subjective picks for Code Size, Size Penalty, and Product Factors.
The successor to the COCOMO formula above asks the project manager to pick many more parameters. COCOMO II adds three more formulas to adjust estimates for 1) developing prototypes, 2) accounting for the amount of code reuse, and 3) a post-detailed-architecture estimate. This last formula expands Size Penalty by adding a normalized product of 5 independent factors and replaces Product Factors by a product of 17 independent factors.
The British Computer Society Survey of more than 1000 projects mentioned in Chapter 1 found that 92% of project managers made their estimates using experience instead of formulas ((Taylor 2000)).
As no more than 20% to 30% of projects meet their budget and schedule, what happens to the rest? Another 20% to 30% of the projects are indeed cancelled or abandoned, but the remaining 40% to 50% are still valuable to the customer even if late. Customers and providers typically then negotiate a new contract to deliver the product with a more limited set of features by a near-term date.
Function points are an alternative measure to LOC that can lead to estimates that are more accurate. They are based on the function inputs, outputs, external queries, input files, output files, and the complexity of each. The corresponding productivity measure is then function points per person-month.
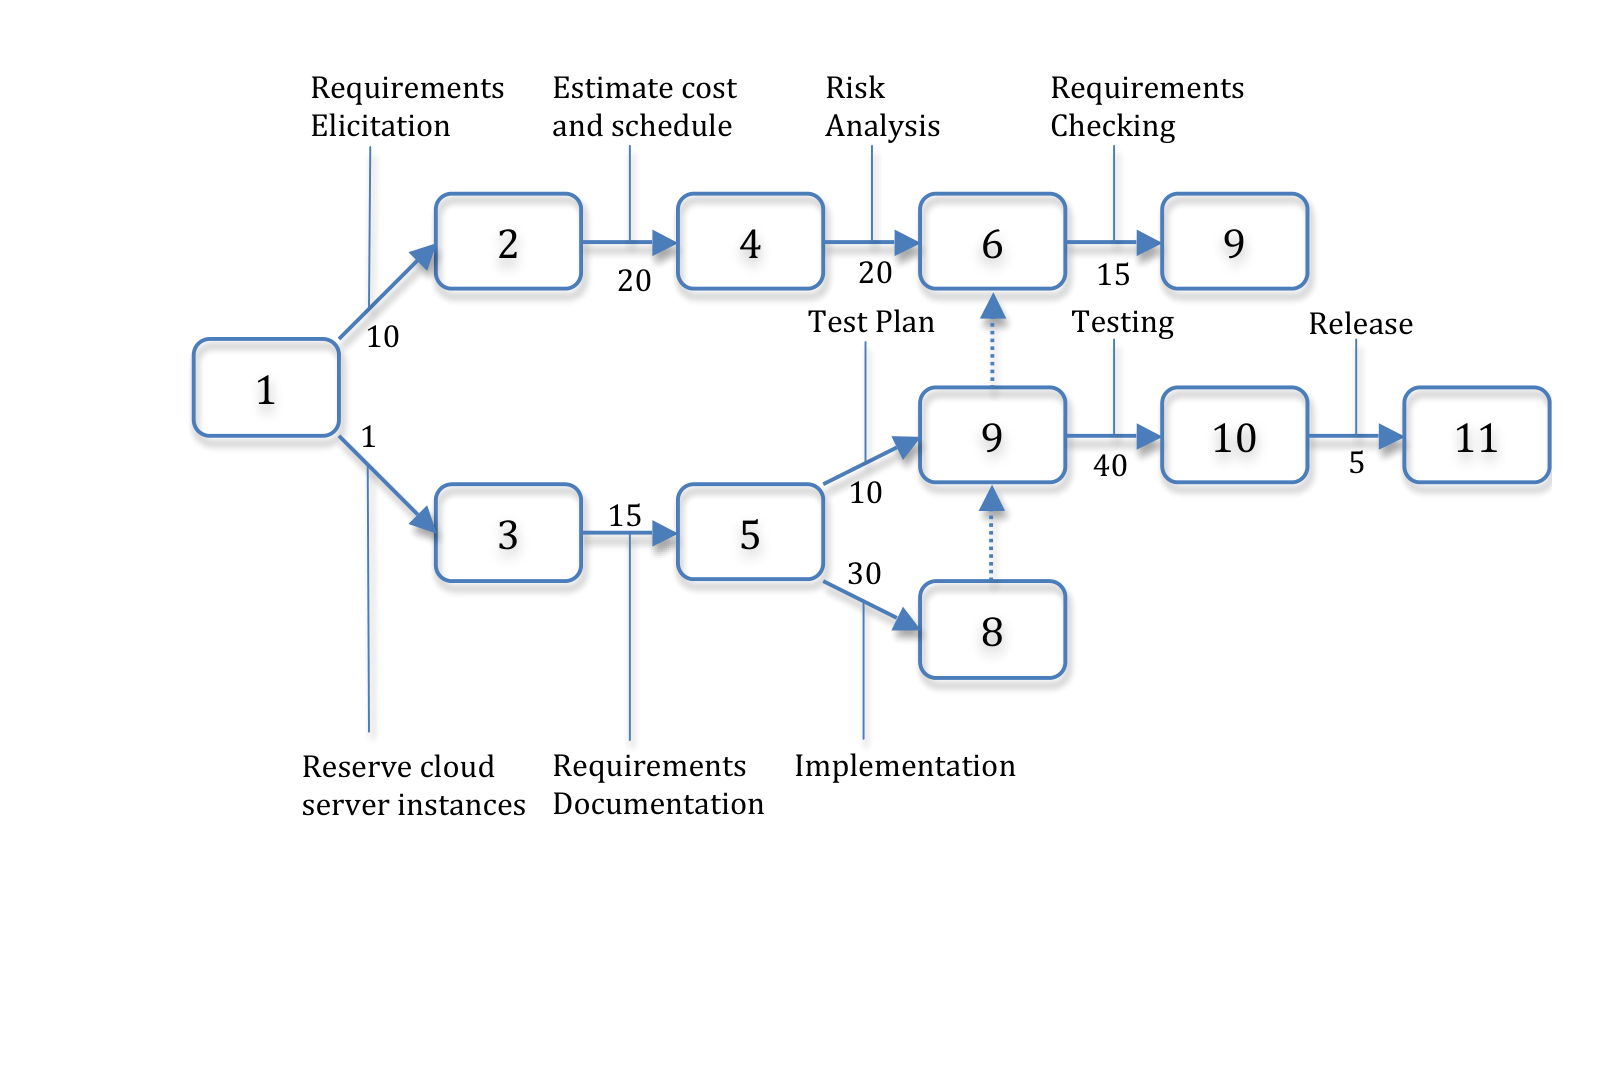
4. Scheduling and Monitoring Progress. Given the SRS has been broken into tasks whose effort has been estimated, the next step is to use a scheduling tool that shows which tasks can be performed in parallel and which have dependencies so they must be performed sequentially. The format is typically a box and arrow diagram such as a PERT chart, which can identify the critical path or minimum time for project.
PERT stands for Program Evaluation and Review Technique, which was invented by the US Navy in the 1950s for its nuclear submarine program.
For example, in Figure 7.8, the shortest possible path from step 1 (the starting state) to step 11 (software release) must traverse the nodes 3, 5, 9, and 10. The project manager places the graph in a table with rows associated with the people on the project, and then assigns people to tasks.
Once again, this process is typically done twice, once when bidding the contract, and once after the contract is won and the detailed architecture design is complete. Safety margins are again used to ensure that the first schedule, which is when the customer expects the product to be released, is not longer than the second version.
Similar to calculating velocity, the project manager can see if the project is behind by comparing the predicted expenditures and time for tasks to the actual expenditures and progress to date. A way to make project status clear to all stakeholders is to add intermediate milestones to the schedule, which lets everyone see if the project is on schedule and on budget.
Requirements Creep is the term developers use to describe the dreaded increase in requirements over time.
5. Change Management for Requirements, Cost, and Schedule. As stated many times in this book, customers are likely to ask for changes to the requirements as the project evolves for many reasons, including a better understanding of what is wanted after trying a prototype, changing market conditions for the project, and so on. The challenge for the project manager is keeping the requirements documents, the schedule, and cost predictions up-to-date as the project changes. Thus, version control systems are needed for evolving documents as well as for programs, so the norm should be checking in the revised documentation along with the revised code.
6. Ensuring Implementation Matches Requirement Features. The Agile process consolidates these many major tasks into three tightly coupled ones: User Stories, acceptance tests in Cucumber, and the code that comes from the BDD/TDD process. Thus, there is little confusion in the relationship between particular stories, tests, and code.
However, plan-and-document methodologies involve many more mechanisms without tight integration. Thus, we need tools that allow the project manager to check to see if the implementation matches the requirements. The relationship between features in requirements and what is implemented is called requirements traceability. Tools that implement traceability essentially offer cross-references between a portion of the design, the portion of the code that implements the feature, code reviews that checked it, and the tests that validate it.
If there is both a high-level SRS and a detailed SRS, forward traceability refers to the traditional path from requirements to implementation, while backwards traceability is the mapping from a detailed requirement back to a high-level requirement.
7. Risk Analysis and Management. In an effort to improve the accuracy of cost estimation and scheduling, plan-and-document methodologies have borrowed risk analysis from the business school. The philosophy is that by taking the time up front to identify potential risks to the budget and schedule, a project can either do extra work to reduce the risk of changes, or change the plan to avoid risks. Ideally, risk identification and management occurs over the first third of a project. It does not bode well if they are identified late in the development cycle.
Risks are classified as technical, organizational, or business. An example of a technical risk might be that the relational database chosen cannot scale to the workload the project needs. An organizational risk might be that many members of the team are unfamiliar with J2EE, which the project depends upon. A business risk could be that by the time the project is complete, the product is not competitive in the market. Examples of actions to overcome these risks would be to acquire a more scalable database, send team members to a J2EE workshop, and do a competitive survey of existing products, including their current features and plans for improvements.
The approach to identify risks is to ask everyone for their worst-case scenarios. The project manager puts them into a “risk table,” in which each risk is assigned a probability of happening between 0% and 100%, and an impact on a numeric scale of 1 to 4, representing negligible, marginal, critical, and catastrophic. One can then sort the risk table by the product of the probability and impact of each risk.
There are many more potential risks than projects can afford to address, so the advice is to address the top 20% of the risks, in the hope that they represent 80% of the potential risks to the budget and schedule. Trying to address all potential risks could lead to an effort that is larger than the original software project! Risk reduction is a major reason for iteration in both the Spiral and RUP models. Iterations and prototypes should reduce risks associated with a project.
Section 7.5 mentions asking the customers about risks for the project as part of the cost estimation in Agile, but the difference is that this information is used to decide the range of the cost estimate rather than becoming a significant part of the project itself.
| Tasks | In Plan-and-Document | In Agile |
|---|---|---|
| Requirements Documentation | Software Requirements Specification such as IEEE Standard 830-1998 | User stories, Cucumber, Points, Velocity |
| Requirements Elicitation | Interviews, Scenarios, Use Cases | |
| Change Management for Requirements, Schedule, and Budget |
Version Control for Documentation and Code | |
| Ensuring Requirements Features |
Traceability to link features to tests, reviews, and code | |
| Scheduling and Monitoring | Early in project, contracted delivery date based on cost estimation, using PERT charts. Milestones to monitor progress | |
| Cost Estimation | Early in project, contracted cost based on manager experience or estimates of task size combined with productivity metrics | Evaluate to pick range of effort for time and materials contract |
| Risk Management | Early in project, identify risks to budget and schedule, and take actions to overcome or avoid them |
Summary The hope of the original efforts in software engineering was to make software development as predictable in quality, cost, and schedule as building a bridge. Perhaps because less than a sixth of software projects are completed on time and on budget with full functionality, the plan-and-document process has many steps to try to achieve this difficult goal. Agile does not try to predict cost and schedule at the start of the project, instead relying on working with customers on frequent iterations and agreeing on a range of time for the best effort to achieve the customer’s goals. Rating user stories on difficulty and recording the points actually completed per iteration increases the chances of more realistic estimates. Figure 7.9 shows the resulting different tasks given the differing perspectives of these two philosophies.
Name three plan-and-document techniques that help with requirements elicitation.
Interviewing, Scenarios, and Use Cases.
7.11 Fallacies and Pitfalls
As a developer, this pitfall may seem ridiculous to you. But nontechnical customers sometimes have difficulty distinguishing a highly polished digital mock-up from a working feature! The solution is simple: use paper-and-pencil techniques such as hand-drawn sketches and storyboards to reach agreement with the customer—there can be no doubt that such Lo-Fi mockups represent proposed rather than implemented functionality.
Agile development was inspired in part by the frustration of software developers building what they thought was cool code that customers dropped. The temptation is strong to add a feature that you think would be great, but it can also be disappointing when your work is discarded. User stories help all stakeholders prioritize development and reduce chances of wasted effort on features that only developers love.
Sketches are static; interactions with a SaaS app occur as a sequence of actions over time. You and the customer must agree not only on the general content of the Lo-Fi UI sketches, but on what happens when they interact with the page. “Animating” the Lo-Fi sketches—“OK, you clicked on that button, here’s what you see; is that what you expected?”—goes a long way towards ironing out misunderstandings before the stories are turned into tests and code.
A story is the customer’s view of how a feature should work, such as “Box office manager can generate a report of today’s sales.” Tasks such as “Add Excel export code in Report model” is a developer-facing task that, while it may be part of implementing a story, is not itself something that results in customer value. Use project management and effort estimation tools to track stories, not tasks. Tracker allows multiple specific tasks to be part of a story, but expressing the task itself as a story also entails the further risk that you’ll use the tool as a to-do list, simply checking off tasks when they’re done, rather than tracking the lifecycle of a story and allowing you to improve your skill at estimating project effort.
If you look at web_steps.rb, you’ll quickly notice that low-level, imperative Cucumber steps such as “When I press Cancel” are merely a thin wrapper around Capybara’s “headless browser” API, and you might wonder (as some of the authors’ students have) why you should use Cucumber at all. But Cucumber’s real value is in creating documentation that nontechnical stakeholders and developers can agree on and that serves as the basis for automating acceptance and integration tests, which is why the Cucumber features and steps for a mature app should evolve towards a “mini-language” appropriate for that app. For example, an app for scheduling vacations for hospital nurses would have scenarios that make heavy use of domain-specific terms such as shift, seniority, holiday, overtime, and so on, rather than focusing on the low-level interactions between the user and each view.
Scenarios are comforting to write and satisfying to run (when they pass) because they closely mimic what a real user would do. Indeed, that is why Cucumber tests have value both as validation—you built the right thing, because the test instantiates a user story created in collaboration with the customer—and verification—you built the thing right, because the test passes. However, one thing such tests don’t reveal is whether your code is well factored—whether the different subsystems exercised in the scenario are easily testable, let alone whether each has been thoroughly tested. Unit and module level tests, which are the subject of Chapter 8, are more likely to tell you about the design of your code. Of course, over-reliance on unit and module level tests is just as bad, as the corresponding Pitfall at the end of Chapter 8 reminds us!
When a test fails, it’s trying to tell you something. Sometimes it’s straightforward—there’s a bug in your code. Other times it’s more subtle: your code fulfills the requirements of the user story, but for some reason, it is unusually difficult to test. Either way, the outcome bears investigation. Without an integration test you can trust, it will be hard to detect if future changes cause your existing code to break.
Part of the magic of Behavior-Driven Design (and Test-Driven Development in the next chapter) is that you write the tests before you write the code you need, and then you write code needed to pass the tests. This top-down approach again makes it more likely for your efforts to be useful, which is harder to do when you’re predicting what you think you’ll need. This observation has also been called the YAGNI principle—You Ain’t Gonna Need It.
Beware of overusing Then I should not see…. Because it tests a negative condition, you might not be able to tell if the output is what you intended—you can only tell what the output isn’t. Many, many outputs don’t match, so that is not likely to be a good test. For example, if you were testing for the absence of “Welcome, Dave!” but you accidentally wrote Then I should not see ‘‘Greetings, Dave!’’, the scenario will pass even if the app incorrectly emits “Welcome, Dave!”. Always include positive expectations such as Then I should see… to check results.
Even if you use positive expectations such as Then I should see…, what if the string you’re looking for occurs multiple times on the page? For example, if the logged-in user’s name is Emma and your scenario is checking whether Jane Austen’s book Emma was correctly added to the shopping cart, a scenario step Then I should see “Emma” might pass even if the cart isn’t working. To avoid this pitfall, use Capybara’s within helper, which constrains the scope of matchers such as I should see to the element(s) matching a given CSS selector, as in Then I should see ’’Emma’’ within ’’div#shopping_cart’’, and use unambiguous HTML id or class attributes for page elements you want to name in your scenarios. The Capybara documentation lists all the matchers and helpers.
As should be clear by now, a story is only a candidate for delivery when both the happy path and the most important sad paths have been tested. Of course, as Chapter 8 describes, there are many more ways for something to work incorrectly than to work correctly, and sad-path tests are not intended to be a substitute for finer-grained test coverage. But from the user’s point of view, correct app behavior when the user accidentally does the wrong thing is just as important as correct behavior when they do the right thing.
7.12 Concluding Remarks: Pros and Cons of BDD
In software, we rarely have meaningful requirements. Even if we do, the only measure of success that matters is whether our solution solves the customer’s shifting idea of what their problem is.
*— Jeff Atwood, Is Software Development Like Manufacturing?, 2006
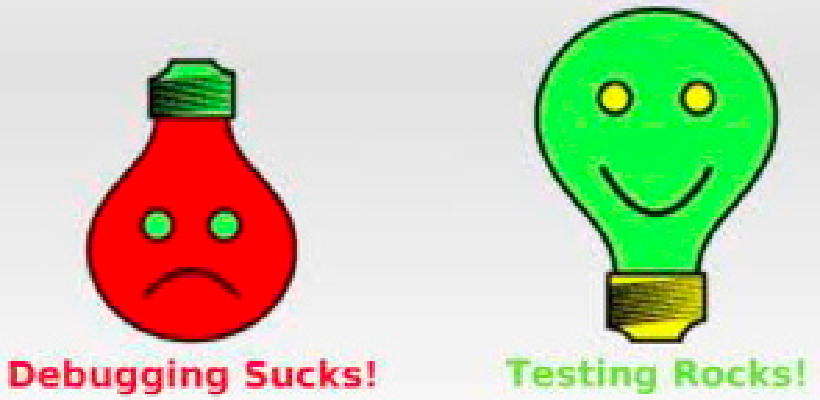
The advantage of user stories and BDD is creating a common language shared by all stakeholders, especially the nontechnical customers. BDD is perfect for projects where the requirements are poorly understood or rapidly changing, which is often the case. User stories also make it easy to break projects into small increments or iterations, which makes it easier to estimate how much work remains. The use of 3x5 cards and paper mockups of user interfaces keeps the nontechnical customers involved in the design and prioritization of features, which increases the chances of the software meeting the customer’s needs. Iterations drive the refinement of this software development process. Moreover, BDD and Cucumber naturally leads to writing tests before coding, shifting the validation and development effort from debugging to testing.
Google places these posters inside restrooms to remind developers of the importance of testing. Used with permission.
Comparing user stories, Cucumber, points, and velocity to the plan-and-document processes makes it clear that BDD plays many important roles in the Agile process:
Requirements elicitation
Requirements documentation
Acceptance tests
Traceability between features and implementation
Scheduling and monitoring of project progress
The downside of user stories and BDD is that it may be difficult or too expensive to have continuous contact with the customer throughout the development process, as some customers may not want to participate. This approach may also not scale to very large software development projects or to safety critical applications. Perhaps plan-and-document is a better match in both situations.
Another potential downside of BDD is that the project could satisfy customers but not result in a good software architecture, which is an important foundation for maintaining the code. Chapter 11 discusses design patterns, which should be part of your software development toolkit. Recognizing which pattern matches the circumstances and refactoring code when necessary (see Chapter 9) reduces the chances of BDD producing poor software architectures.
All this being said, there is enormous momentum in the Ruby community (which places high value on testable, beautiful and self-documenting code) to document and promote best practices for specifying behavior both as a way to document the intent of the app’s developers and to provide executable acceptance tests. The Cucumber wiki is a good place to start.
BDD may not seem initially the natural way to develop software; the strong temptation is to just start hacking code. However, once you have learned BDD and had success at it, for most developers there is no going back. Your authors remind you that good tools, while sometimes intimidating to learn, repay the effort many times over in the long run. Whenever possible in the future, we believe you’ll follow the BDD path to writing beautiful code.
You may find the following resources useful for more depth on the topics in this chapter:
Want to see paper prototyping and storyboards in action? First read this excellent article with examples of paper prototyping, then watch this video of paper storyboarding for a web-based email app.
The Cucumber wiki has links to documentation, tutorials, examples, screencasts, best practices, and lots more on Cucumber.
The Cucumber Book ((Wynne and Hellesøy 2012)), co-authored by the tool’s creator and one of its earliest adopters, includes detailed information and examples using Cucumber, excellent discussions of best practices for BDD, and additional Cucumber uses such as testing RESTful service automation.