7.4. Points and Velocity
One way to measure the productivity of a team would be simply to count the number of user stories completed per iteration, and then calculate the average number of stories per week. The average would then be used to decide how many stories to try to implement each iteration.
The problem with this measure is that some stories are much harder than others, leading to mispredictions. The simple solution is to give each user story an integer number of points reflecting its perceived difficulty. The “value” of a point—the approximate expected number of coding hours it represents—is completely up to the team, and will likely differ across teams, but the point scale should have two important properties. First, everyone on the team should be in rough agreement on how much a “point” is worth. Second, more points should represent not only more effort, but more uncertainty. For example, your team might start with a simple 3-point scale in which 1 point represents approximately a 3-hour work session. Your team might be good at estimating the effort required to complete a 1 or 2 point story this way, but can you confidently estimate that a 3-point story will really take 9 hours of work? For this reason, your team should also set a threshold above which a story must be broken down into smaller tasks before estimating its difficulty, until each task is sufficiently well understood that it can be estimated with high confidence. Therefore, in our simple suggested introductory scheme, you might decide that any story estimated at higher than 3 points must be subdivided into stories that everyone agrees are 3 points or less.
A practical way to estimate points that also builds the team’s collective ownership (knowledge of different parts of the project being diffused around the team) is known as planning poker. During an Iteration Planning Meeting at the beginning of an iteration, the team first prioritizes the stories according to the stated desires of the customer (or the Product Owner speaking for the customer). Each story is discussed in turn: the Project Manager reads and reviews the story to ensure everyone understands what the story requires, then each team member places a card face-down marked with the number of points they think that story should be worth. An even easier variation is to have everyone simultaneously stick out 1 to 5 fingers, in the style of the children’s game Rock–Paper–Scissors. There should be a card (or hand gesture) that means “I don’t know” and another that means “This story is too complicated and should be broken down.” The team then discusses differences in the votes to reach consensus, and they vote again, possibly after subdividing the story. An inability to reach consensus may indicate a story that isn’t SMART.
When should a story get more points? Some stories may require information-gathering, such as becoming familiar with other parts of the codebase or doing some scouting to deter- mine which files or classes in the app will be affected by the proposed feature. A major source of uncertainty, such as figuring out how to integrate a new technology or library, should get its own spike: a short investigation into a technique or problem that the team wants explored before sitting down to do serious coding. An example would be a spike on incorporating recommendations into an app, in which a developer or pair investigates different algorithms and different libraries that could be used, possibly using a scratch branch of the code (which we discuss in Section 10.2) to do some basic testing and exploration. After a spike is done, the spike code must be thrown away: The spike’s purpose is to help you determine what approach you want to follow, and now that you know, you should write it correctly.
The backlog is the collection of stories that have been prioritized and assigned points in this way, but have not yet been started in this iteration. The team then begins delivering the backlog, that is, working on the stories in priority order during the iteration. (Section 10.4 presents best practices for coordinating this work.) At the end of the iteration, the team computes the total number of points completed, rather than the number of stories. The moving average of this total is called the team’s velocity.
Velocity measures work rate based on the team’s self-evaluation. As long as the team rates user stories consistently, it doesn’t matter whether the team is completing 5 points or 10 points per iteration. The purpose of velocity is to give all stakeholders an idea how many iterations it will take a team to add the desired set of features, which helps set reasonable expectations and reduces chances of disappointment. Points and velocity are often used as the basis of a burn down chart, which shows work to be done (points) on the vertical axis and time along the horizontal axis. The slope of the downward-pointing line is the team’s velocity, and the line’s intersection with the x-axis represents the prediction for when the work will be done.
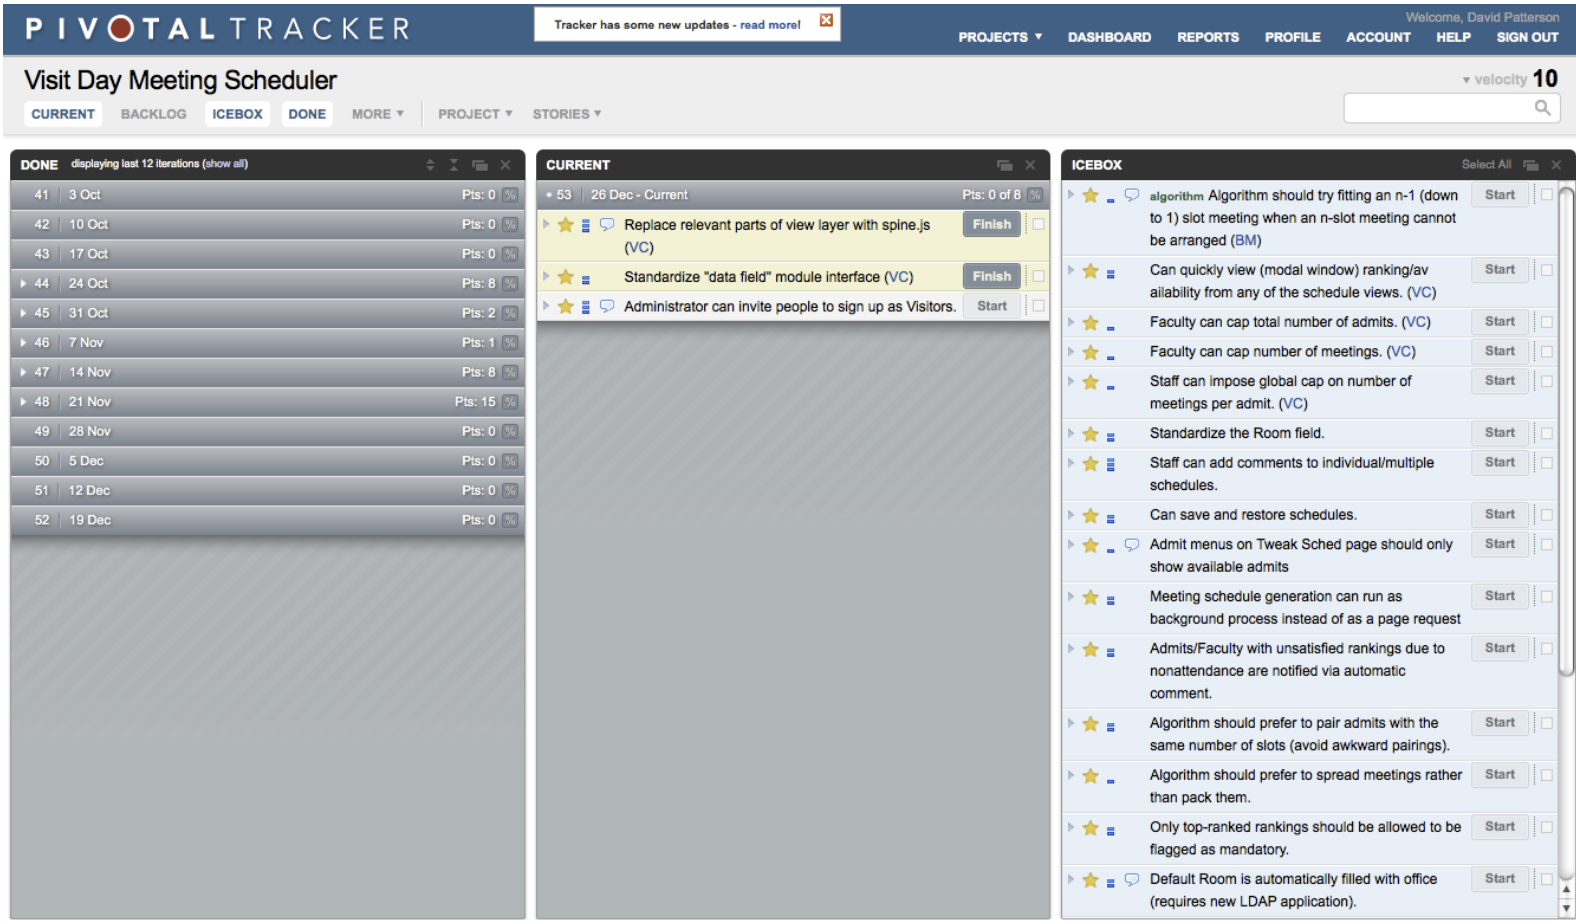
Figure 7.3 shows the UI of Pivotal Tracker, a Web-based tool that allows a team to enter and prioritize user stories with point values, assign stories to developers, attach design documents such as lo-fi mockups to stories, and perhaps most importantly, track points and velocity as stories are delivered, optionally generating a variety of analytics including burn down charts. Tracker also provides an Icebox panel, which contains unprioritized stories. They can stay “on ice” indefinitely, but when you’re ready to start working on them, just drag them to the Current or Backlog panels. Tracker provides a way to enter a spike and prioritize it relative to other stories, so the team knows that certain stories cannot be completed until the spike is done. Similarly, one story can be marked as being blocked by another, indicating a dependency that must be taken into account when arranging the backlog in priority order. Finally, since complex stories representing a single “feature” should be broken down into smaller stories, Tracker provides Epics as a way of grouping related stories and tracks how many total points are still needed to complete the epic, regardless of how the stories are ordered in the backlog. The idea is to give software engineers the big picture of where the application is in the development process with regard to big features.
Because Tracker calculates velocity based on points completed, it groups the remaining prioritized stories in the backlog into iterations based on the assumption that velocity will remain approximately constant. These estimates can be useful in setting customer expecta- tions as to when a particular feature will be delivered. Tracker even allows the insertion of Release markers, which bound the stories that must all be delivered before a particular fea- ture is completely working and ready to announce to the customer. (We will have more to say about releases in Section 12.4.) This approach is in sharp contrast to management by schedule, in which a manager picks a release date and the team is expected to work hard to meet the deadline.
Some teams use GitHub Issues to track stories as a to-do list, or a project management tool such as Trello to put virtual story cards on a virtual wall. These simpler tools are fine to start out with, but they lack the ability to track points and velocity, and therefore to supply estimates of story completion time in more complicated projects. In addition, Tracker is a good place to centralize information about the project—design notes, architecture diagrams, lo-fi sketches, and so on—because you can associate it with individual user stories and even link out to documents in Google Docs or other places. Every GitHub repository also includes a Wiki, which allows team members to jointly edit a document and add files. Whatever tool you choose, the important thing is to keep all documentation about the project accessible from one place that the whole team can agree on, and which will remain stable even as members of the team come and go.
Self-Check 7.4.1. True or False: When comparing two teams, the one with the higher velocity is more productive.
False: Since each team assigns points to user stories, you cannot use velocity to compare different teams. However, you could look over time for a given team to see if there were iterations that were significantly less or more productive.
Self-Check 7.4.2. True or False: When you don’t know how to approach a given user story, just give it 3 points.
False: A user story should not be so complex that you don’t have an approach to imple- menting it. If they are, you should go back to your stakeholders to refactor the user story into a set of simpler tasks that you do know how to approach.