7.9. The Plan-And-Document Perspective on Documentation
As is well known to software engineers (but not to the general public), by far the largest class of [software] problems arises from errors made in the eliciting, recording, and analysis of requirements.
—Daniel Jackson, Martyn Thomas, and Lynette Millett (Editors), Software for Dependable Systems: Sufficient Evidence?, 2007
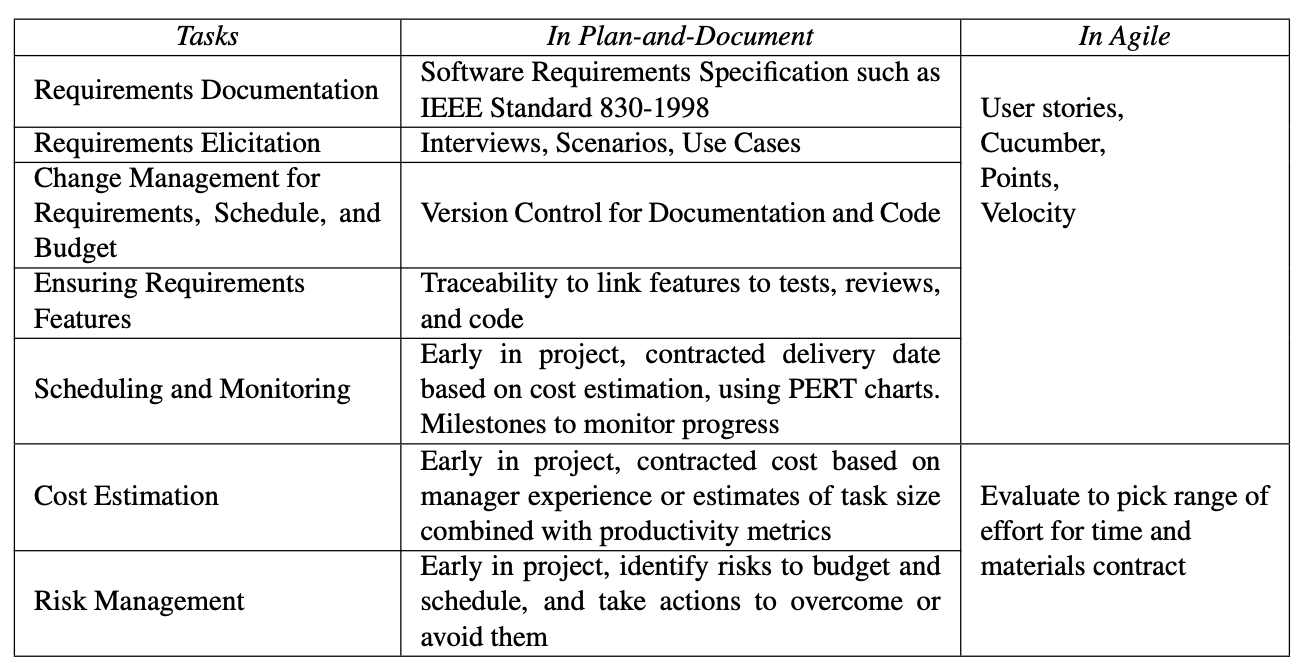
Recall that the hope for plan-and-document methods was to make software engineering as predictable in budget and schedule as civil engineering. Remarkably, user stories, points, and velocity correspond to seven major tasks of the plan-and-document methodologies. They include:
Requirements Elicitation
Requirements Documentation
Cost Estimation
Scheduling and Monitoring Progress
These are done up front for the Waterfall model and at the beginning of each major iteration for the Spiral and RUP models. As requirements change over time, these items above imply other tasks:
Change Management for Requirements, Cost, and Schedule
Ensuring Implementation Matches Requirement Features
Finally, since accuracy of the budget estimate and the schedule is vital to the success of the plan-and-document process, there is another task not found in BDD:
Risk Analysis and Management
The hope is that by imagining all the risks to the budget and schedule in advance, the project can make plans to avoid or overcome them.
As we shall see in Chapter 10, the plan-and-document processes assume that each project has a manager. While the whole team may participate in requirements elicitation and risk analysis and help document them, it is up to the project manager to estimate costs, make and maintain the schedule, and decide which risks to address and how to overcome or avoid them.
Advice for project managers comes from all corners, from practitioners who offer guidelines and rules of thumb based on their experience to researchers who have measured many projects to come up with formulas for estimating budget and schedule. There are also tools to help. Despite this helpful advice and tools, the project statistics from Chapter 1 (Johnson 1995, 2009)—that 40% to 50% exceed the budget and schedule by factors of 1.7 to 3.0 and that 20% to 30% of projects are cancelled or abandoned—document the difficulty of making accurate budgets and schedules.
We now give quick overviews of these seven tasks so that you can be familiar with what is done in plan-and-document processes to give you a head start if you need to use them in the future. These overviews help explain the inspiration for the Agile Manifesto. If you are unclear on how to successfully perform these tasks, it may be due more to their inherent difficulties rather than to brevity.
1. Requirements Elicitation. Like User Stories, requirement elicitation involves participation by all stakeholders, using one of several techniques. The first is interviewing, where stakeholders answer predefined questions or just have informal discussions. Note that one goal is to understand the social and organization environment to see how tasks are really done versus the official story. Another technique is to cooperatively create scenarios, which can start with an initial assumption of the state of the system, show the flow of the system for a happy case and a sad case, list what else is going on in the system, and then the state of the system at the end of the scenario. Related to scenarios and user stories, a third technique is to create use cases, which are lists of steps between a person and a system to achieve a goal (see the elaboration in Section 7.1).
In addition to functional requirements such as those listed above, non-functional requirements include performance goals, dependability goals, and so on.
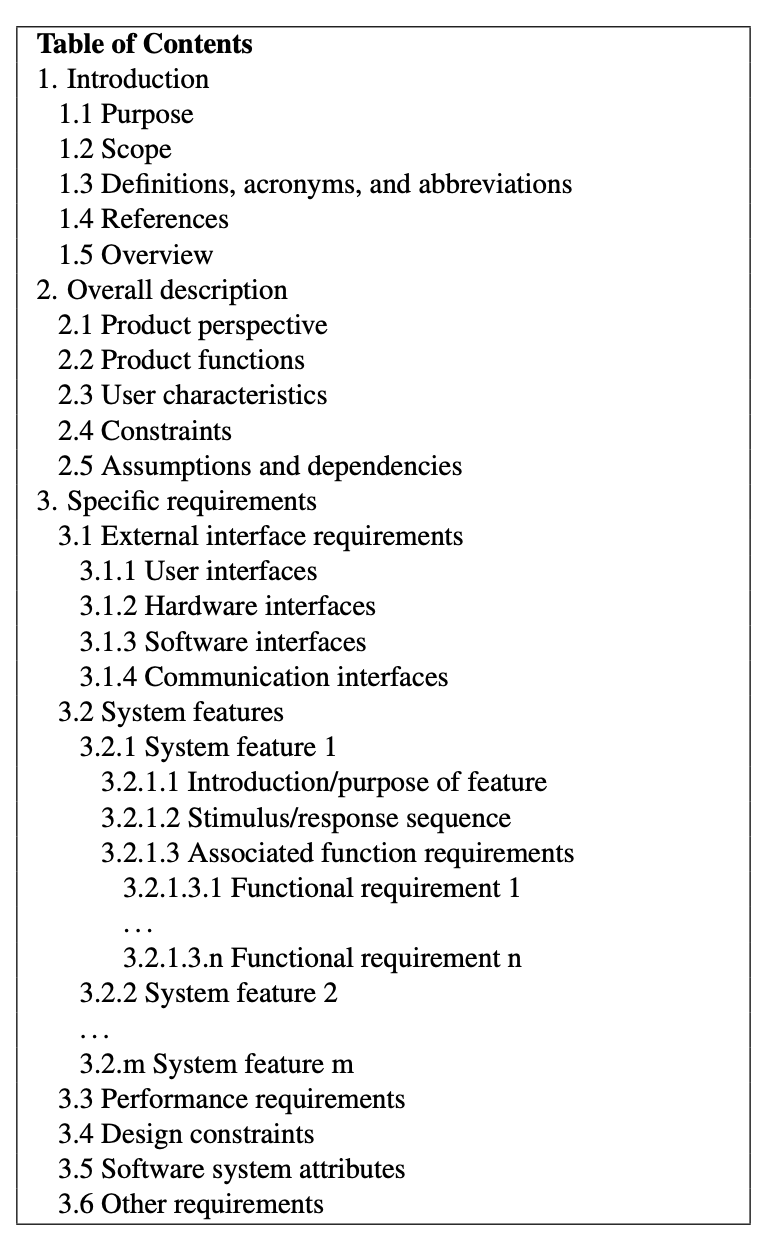
2. Requirements Documentation. Once elicited, the next step is to document the re- quirements in a Software Requirements Specification (SRS). Figure 7.6 gives an outline for an SRS based on IEEE Standard 830-1998. A SRS for a patient management system7 is 14 pages long, but they are often hundreds of pages.
Part of the process is to check the SRS for:
Validity–are all these requirements really necessary?
Consistency–do requirements conflict?
Completeness–are all requirements and constraints included? • Feasibility–can the requirements really be implemented?
Techniques to test for these four characteristics include having stakeholders—developers, customers, testers, and so on—proof-read the document, trying to build a prototype that in- cludes the basic features, and generating test cases that check the requirements.
A project may find it useful to have two types of SRS: a high-level SRS that is for man- agement and marketing and a detailed SRS for the project development team. The former is presumably a subset of the latter. For example, the high-level SRS might leave out the functional requirements that correspond to 3.2.1.3 in Figure 7.6.
3. Cost Estimation. The project manager then decomposes the SRS into the tasks to implement it, and then estimates the number of weeks to complete each task. The advice is to decompose no finer than one week. Just as a user story with more than seven points should be divided into smaller user stories, any task with an estimate of more than eight weeks should be further divided into smaller tasks.
The total effort is traditionally measured in person-months, perhaps in homage to Brooks’s classic software engineering book The Mythical Man-Month (Brooks 1995). Managers use salaries and overhead rates to convert person-months into an actual budget.
The cost estimate is likely done twice: once to bid a contract, and once again after the contract is won. The second estimate is done after the software architecture is designed, so that the tasks as well as the effort per task can be more easily and accurately identified.
The project manager surely wants the second estimate to be no larger than the first, since that is what the customer will pay. One suggestion is to add a safety margin by multiplying your original estimate by 1.3 to 1.5 to try to handle estimation inaccuracy or unforeseen events. Another is to make three estimates: a best case, expected case, and worst case, and then use that information to make your best guess.
The two approaches to estimating are experiential or quantitative. The first assumes the project managers have significant experience either at the company or in the industry, and they rely on that experience to make accurate estimates. It certainly increases confidence when the project is similar to tasks that the organization has already successfully completed.
The quantitative or algorithmic approach is to estimate the programming effort of the tasks in a technical measure such as lines of code (LOC), and then divide by a productivity measure like LOC per person-month to yield person-months per task. The project manager can get help from others to get estimates on LOC, and like velocity, can look at the historical record of the organization’s productivity to calculate person-months.
ince cost estimates for software projects have such a dismal record, there has been considerable effort on improving the quantitative approach by collecting information about com- pleted projects and finding models that predict the outcomes (Boehm and Valerdi 2008). The next step in sophistication follows this formula:
where Organizational Factors include practices for this type of product, Code Size is measured as before, Size Penalty reflects that effort is not linear in code size, and Product Factors include experience of development team with this type of product, dependability require- ments, platform difficulty, and so on. Example constants from real projects are 2.94 for Organizational Factors; Size Penalty between 1.10 and 1.24; and Product Factors between 0.9 and 1.4.
While these estimates are quantitative, they certainly depend on the project manager’s subjective picks for Code Size, Size Penalty, and Product Factors.
The successor to the COCOMO formula above asks the project manager to pick many more parameters. COCOMO II adds three more formulas to adjust estimates for 1) develop- ing prototypes, 2) accounting for the amount of code reuse, and 3) a post-detailed-architecture estimate. This last formula expands Size Penalty by adding a normalized product of 5 independent factors and replaces Product Factors by a product of 17 independent factors.
The British Computer Society Survey of more than 1000 projects mentioned in Chapter 1 found that 92% of project managers made their estimates using experience instead of formulas (Taylor 2000).
As no more than 20% to 30% of projects meet their budget and schedule, what happens to the rest? Another 20% to 30% of the projects are indeed cancelled or abandoned, but the remaining 40% to 50% are still valuable to the customer even if late. Customers and providers typically then negotiate a new contract to deliver the product with a limited set of missing features by a near-term date.
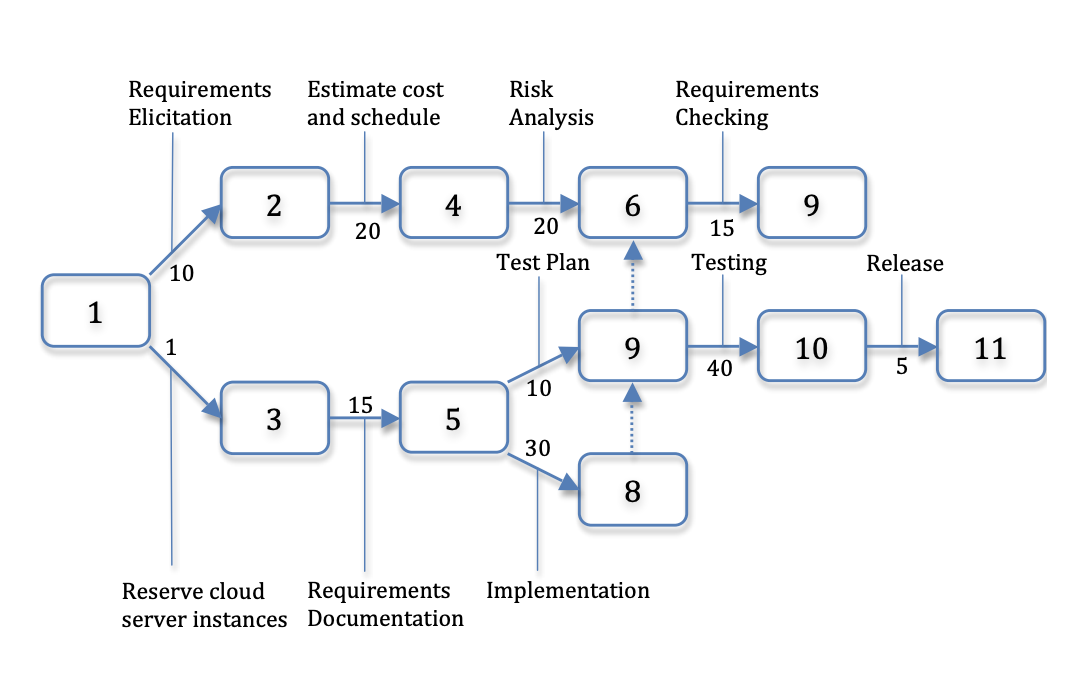
4. Scheduling and Monitoring Progress. Given the SRS has been broken into tasks whose effort has been estimated, the next step is to use a scheduling tool that shows which tasks can be performed in parallel and which have dependencies so they must be performed sequentially. The format is typically a box and arrow diagram such as a PERT chart, which can identify the critical path or minimum time for project. For example, in Figure 7.7, the shortest possible path from step 1 (the starting state) to step 11 (software release) must traverse the nodes 3, 5, 9, and 10. The project manager places the graph in a table with rows associated with the people on the project, and then assigns people to tasks.
Once again, this process is typically done twice, once when bidding the contract, and once after the contract is won and the detailed architecture design is complete. Safety margins are again used to ensure that the first schedule, which is when the customer expects the product to be released, is not longer than the second version.
Similar to calculating velocity, the project manager can see if the project is behind by comparing the predicted expenditures and time for tasks to the actual expenditures and progress to date. A way to make project status clear to all stakeholders is to add intermediate milestones to the schedule, which lets everyone see if the project is on schedule and on budget.
5. Change Management for Requirements, Cost, and Schedule. As stated many times in this book, customers are likely to ask for changes to the requirements as the project evolves for many reasons, including a better understanding of what is wanted after trying a prototype, changing market conditions for the project, and so on. The challenge for the project manager is keeping the requirement documents, the schedule, and cost predictions up-to-date as the project changes. Thus, version control systems are needed for evolving documents as well as for programs, so the norm should be checking in the revised documentation along with the revised code.
6. Ensuring Implementation Matches Requirement Features. The Agile process consolidates these many major tasks into three tightly coupled ones: User Stories, acceptance tests in Cucumber, and the code that comes from the BDD/TDD process. Thus, there is little confusion in the relationship between particular stories, tests, and code.
However, plan-and-document methodologies involve many more mechanisms without tight integration. Thus, we need tools that allow the project manager to check to see if the implementation matches the requirements. The relationship between features in requirements and what is implemented is called requirements traceability. Tools that implement traceability essentially offer cross-references between a portion of the design, the portion of the code that implements the feature, code reviews that checked it, and the tests that validate it.
If there is both a high-level SRS and a detailed SRS, forward traceability refers to the traditional path from requirements to implementation, while backwards traceability is the mapping from a detailed requirement back to a high-level requirement.
7. Risk Analysis and Management. In an effort to improve the accuracy of cost estimation and scheduling, plan-and-document methodologies have borrowed risk analysis from the business school. The philosophy is that by taking the time up front to identify potential risks to the budget and schedule, a project can either do extra work to reduce the risk of changes, or change the plan to avoid risks. Ideally, risk identification and management occurs over the first third of a project. It does not bode well if they are identified late in the development cycle.
Risks are classified as technical, organizational, or business. An example of a technical risk might be that the relational database chosen cannot scale to the workload the project needs. An organizational risk might be that many members of the team are unfamiliar with J2EE, which the project depends upon. A business risk could be that by the time the project is complete, the product is not competitive in the market. Examples of actions to overcome these risks would be to acquire a more scalable database, send team members to a J2EE workshop, and do a competitive survey of existing products, including their current features and plans for improvements.
The approach to identify risks is to ask everyone for their worst-case scenarios. The project manager puts them into a “risk table,” in which each risk is assigned a probability of happening between 0% and 100%, and an impact on a numeric scale of 1 to 4, representing negligible, marginal, critical, and catastrophic. One can then sort the risk table by the product of the probability and impact of each risk.
There are many more potential risks than projects can afford to address, so the advice is to address the top 20% of the risks, in the hope that they represent 80% of the potential risks to the budget and schedule. Trying to address all potential risks could lead to an effort that is larger than the original software project! Risk reduction is a major reason for iteration in both the Spiral and RUP models. Iterations and prototypes should reduce risks associated with a project.
Section 7.5 mentions asking the customers about risks for the project as part of the cost estimation in Agile, but the difference is that this information is used to decide the range of the cost estimate rather than becoming a significant part of the project itself.
Self-Check 7.9.1. Name three plan-and-document techniques that help with requirements elicitation.
Interviewing, Scenarios, and Use Cases.